On this page
You hear it on the news most evenings: the Sensex is up, or a company's shares crashed. This guide explains what that means the way a maths class would, with one worked example. Nothing here is investing advice.
What is the stock market in simple words?
The stock market is a marketplace where buyers and sellers come together to trade shares and other securities, in the words of SEBI's investor education site. SEBI, the Securities and Exchange Board of India, is the statutory body that regulates India's securities market.
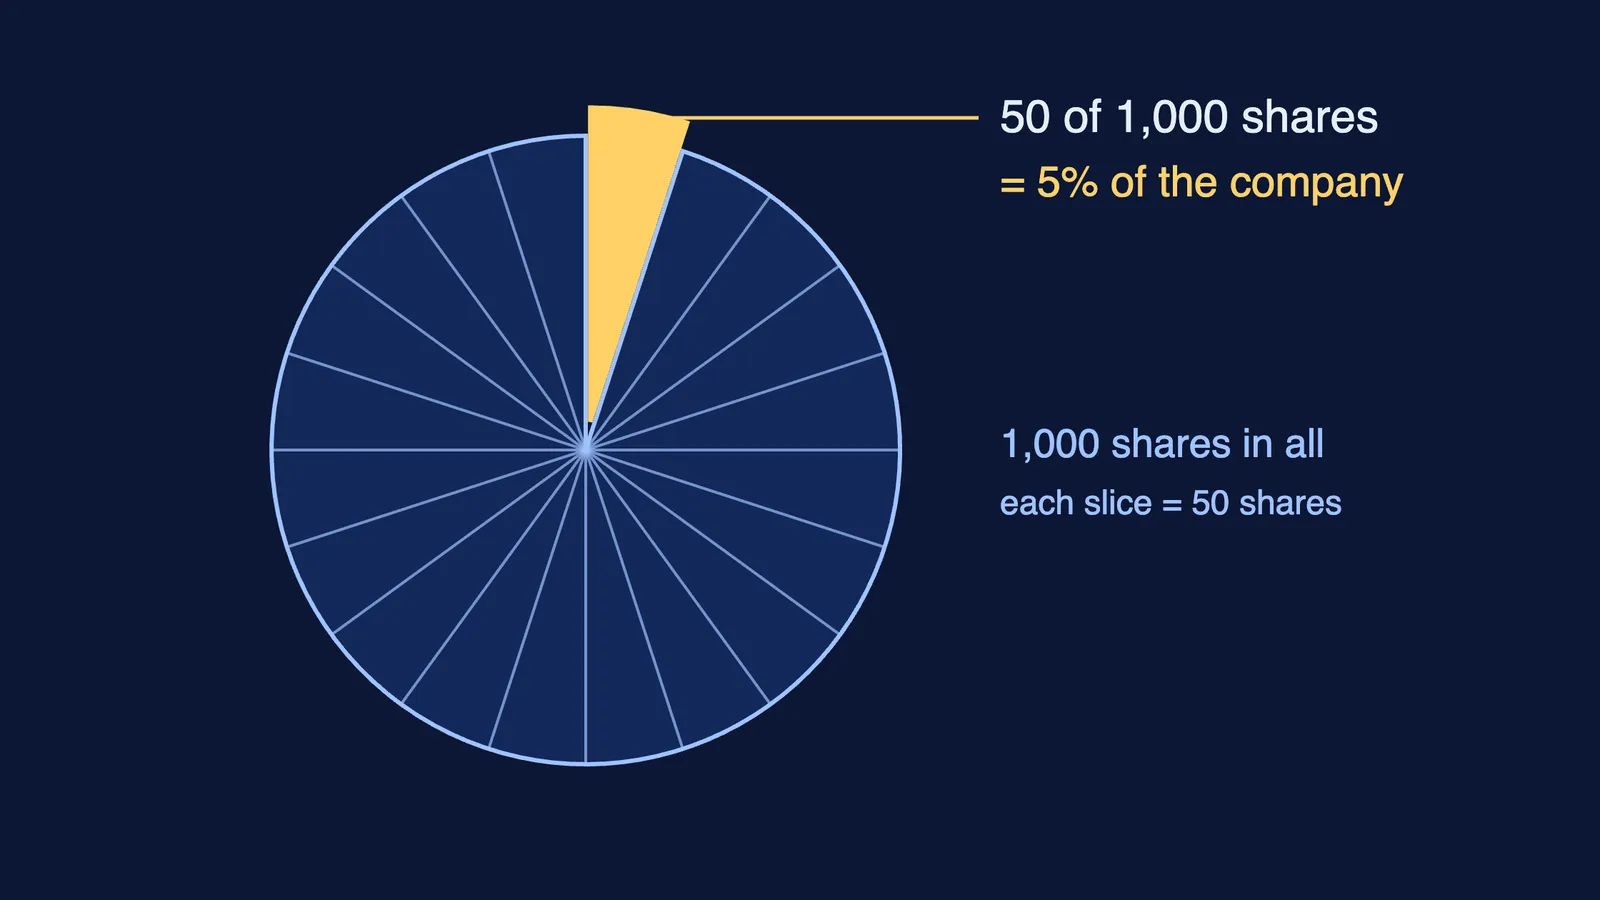
A share is a small piece of ownership in a company. SEBI's page on shares gives a clean example: if a company has 1,000 shares and you buy 50, you own 5% of it. Shareholders can also vote on important decisions at the company's general meeting, and may receive a dividend when the company shares its profit, though the same page says dividends are not guaranteed.
Companies sell shares to raise money. After that, people trade those shares with each other on a stock exchange, so you usually buy from another person, not from the company.
Why do share prices go up and down?
A share has no fixed price. It trades at whatever a buyer is willing to pay and a seller is willing to accept at that moment. When buyers are keener than sellers, the price rises; when sellers are keener, it falls.
News about profits, a new product, interest rates or the economy, even rumours, changes their minds. That is why nobody can tell you for certain where a price will be next week.
What are the Sensex and the Nifty?
An index is a single number that tracks how a group of shares is doing. SEBI's page on market indices describes it as a way to measure how the market is doing overall.
The Sensex includes 30 large, well-known companies from different sectors of the Indian economy, according to SEBI. The Nifty 50 tracks 50 of the largest and most frequently traded companies listed on the National Stock Exchange (NSE), the same page says. When those companies are doing well, the index goes up.
It works like the samosa price index we built to explain inflation: many prices squeezed into one number you can follow over time.
How do you read a share price change?
The numbers below are made up for practice, not real prices. Real Sensex values are published on the BSE website.
A share costs ₹200 on Monday and ₹230 on Friday. The change is ₹30, and 30 ÷ 200 = 0.15, so it rose 15%.
The next week it falls 15%. That is 15% of ₹230, which is ₹34.50, so the price is now ₹195.50.
It went up 15% and down 15%, yet it ended below where it started, because the fall was taken from a bigger number.
Now an index: if an index at 80,000 falls 800 points, that is 800 ÷ 80,000 = 1%. A headline of "800 points down" sounds dramatic; as a percentage it is small.
Percentage change is the one piece of school maths that makes market news readable. Our explainer on what 150 percent means is good practice.
If percentages still feel slippery, the Fermi Concept Library covers every concept in mathematics, each with its own lesson.
What is the risk?
Share prices can fall, and money can be lost. SEBI's own investor page says there are no guarantees of returns in the stock market (SEBI).
Fast trading is riskier still. A SEBI study released in September 2024 found that 93% of over 1 crore individual traders in equity futures and options (F&O) lost money between FY22 and FY24, with average losses of around ₹2 lakh each, including transaction costs. The same study found that the share of F&O traders below 30 years old rose from 31% in FY23 to 43% in FY24.
So if a friend, an influencer or a Telegram group promises sure-shot profits, treat that as a warning sign. Parents dealing with a teen who already wants to trade can use our supervised plan for teens who want to trade crypto or stocks.
How can you learn about the market without spending money?
Try this four-week plan in a notebook:
Week 1: write down the Sensex closing value each evening and work out the daily percentage change.
Week 2: pick three companies whose products you use. Find out what each one sells and how it makes money.
Week 3: note those three share prices every day, and next to each big move, write the news you think caused it.
Week 4: compare your notes. Were you able to predict any move in advance? If not, that tells you something about short-term prices.