
On this page
Hang a weight on a wire, add a little more, and keep going until it snaps. That is the experiment behind the stress-strain curve in Class 11 physics, and it makes far more sense when you run it in a simulation and guess each stage first.
What does a stress-strain curve show?
The definitions below come from NCERT's Class 11 chapter Mechanical Properties of Solids.
Stress is the restoring force per unit area, F/A, measured in N m⁻² or pascal (Pa).
Strain is the fractional change in length, ΔL/L, so it has no unit.
Young's modulus (Y) is stress divided by strain in the straight-line part of the curve, which makes it the slope of that line.
NCERT's Table 8.1 gives steel a Young's modulus of 200 GPa, a yield strength of 250 MPa and an ultimate strength of 400 MPa (NCERT, Table 8.1).
What should you predict before you stretch the wire?
Write your predictions down first. Take a steel wire 1 m long with a cross-section of 1 mm² (10⁻⁶ m²) and use NCERT's values for steel (NCERT, Table 8.1):
Linear region. Stress and strain rise together in a straight line. Every 100 N of load adds 10⁸ Pa of stress and 10⁸ / (2 × 10¹¹) = 0.05% strain, which is 0.5 mm on a 1 m wire.
Elastic limit and yield. Yield comes at 250 MPa, which is 250 N on this wire. Treating the line as straight up to yield, the strain there is (250 × 10⁶) / (200 × 10⁹) = 0.125%, an extension of only about 1.25 mm.
Plastic region. Past yield, the wire stretches a lot for little extra load, and will not return to 1 m if unloaded.
Ultimate strength. Stress peaks at 400 MPa, a load of about 400 N.
Breaking point. After the peak the wire keeps stretching while the force drops, then it fractures.
NCERT gives a check on this method: a steel wire of 0.1 cm² cross-section needs 2000 N to stretch by 0.1% (NCERT, section 8.5), and 200 GPa × 0.001 × 10⁻⁵ m² gives exactly that.
How do you read the elastic limit, yield point and breaking point?
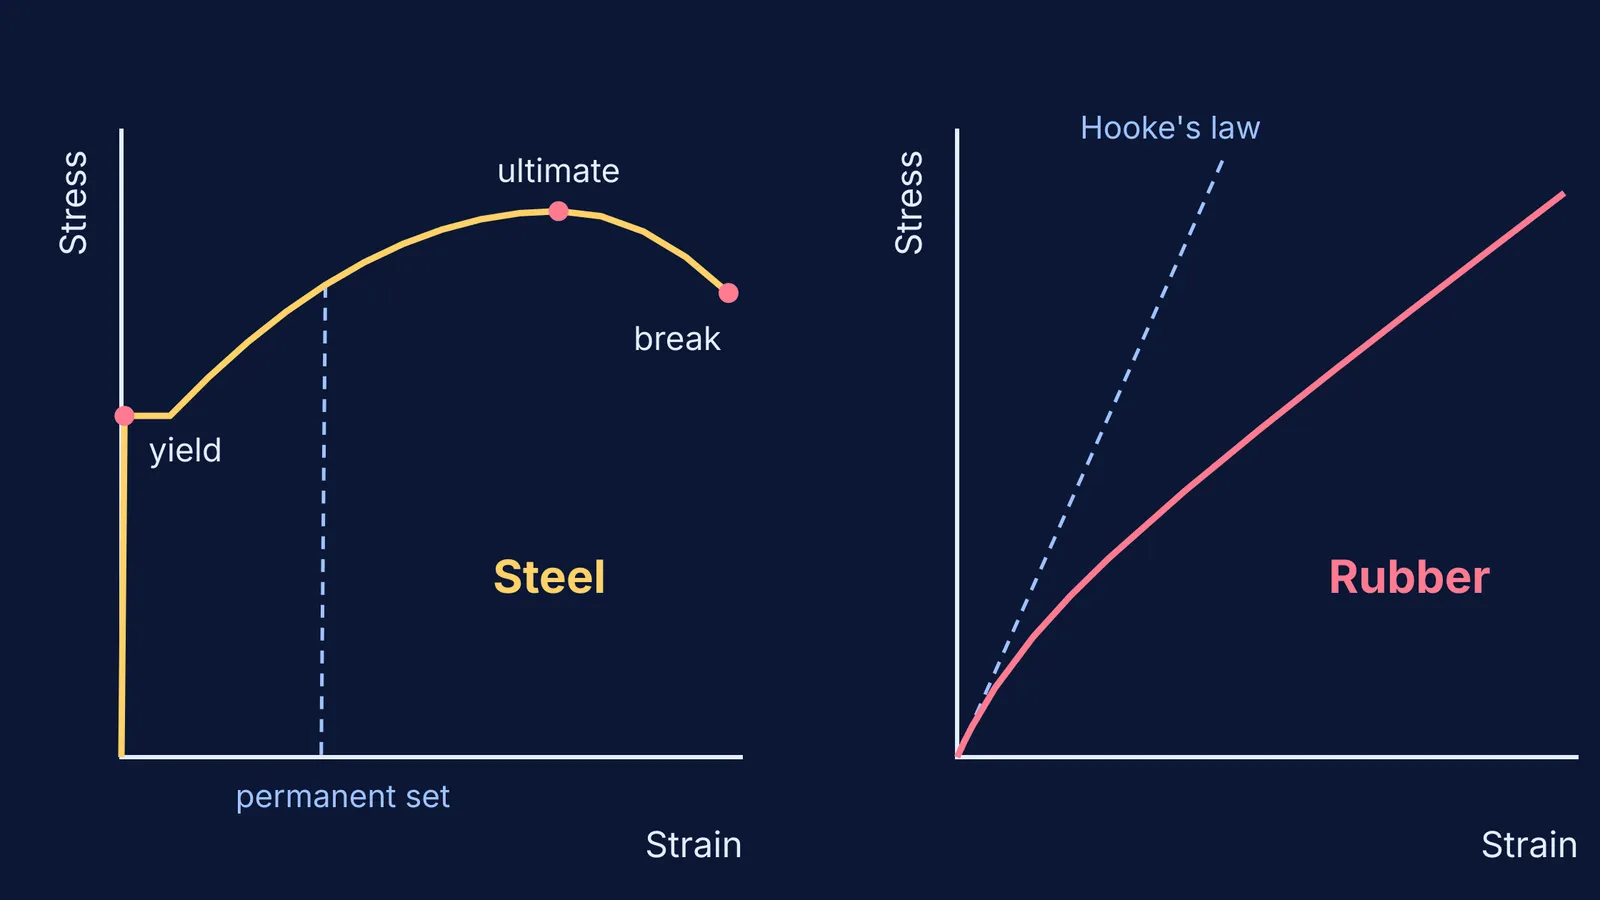
NCERT's Figure 8.2 labels a typical metal curve with five points (NCERT, section 8.4):
O to A: a straight line. Hooke's law holds and the wire returns to its original length. A is the proportional limit.
A to B: stress and strain are no longer proportional, but the wire still recovers when unloaded. B is the yield point, also called the elastic limit, and the stress there is the yield strength.
B to D: strain grows quickly. Unload at a point C here and some stretch stays: a permanent set, from plastic deformation.
D: the ultimate tensile strength, the highest stress on the curve.
E: the fracture point. Beyond D, extra strain comes even with a reduced force, and the wire breaks at E.
If D and E are close together the material is brittle; if far apart, ductile.
Why does rubber's curve look so different from steel's?
NCERT notes that rubber can be pulled to several times its original length and still return to its original shape (NCERT, section 8.4). Its Figure 8.3, for the elastic tissue of the aorta, shows a very large elastic region that does not obey Hooke's law over most of its range, and no well-defined plastic region. NCERT calls materials like aorta tissue and rubber elastomers.
Rubber is also far less stiff. Rubber's Young's modulus at small strain is about 0.01 to 0.1 GPa, against 200 GPa for steel, and rubber is classed as a non-linear material (Young's modulus table). That makes steel roughly 2,000 to 20,000 times stiffer.
So when you switch to rubber, predict three changes: strain runs to hundreds of percent, the curve bends instead of running straight, and there is no sharp yield point. Steel is still "more elastic" in the physics sense, because it takes a much larger force to produce the same strain; we explain that wording in why steel is more elastic than rubber.
How should you practise with a stress-strain simulation?
A 10-minute routine before a test:
Fill in the five-step prediction list above for steel, with numbers.
Run it and mark where you were off.
Unload once before and once after yield, and note the permanent set.
Switch to rubber and sketch the shape before you press play.
Finish with one numerical, such as how a wire's extension changes when its length and radius are doubled.
You can run this kind of experiment in the Fermi Simulation Lab, our interactive simulations for ideas that are easier to see than to read. If a result surprises you, read our guide to using an AI tutor alongside a physics simulation.