
On this page
Open a school atlas to the world climate map and you are most likely looking at a system first worked out by Wladimir Köppen, a Russian-born German scientist who trained as a botanist. A 2007 study in Hydrology and Earth System Sciences noted that his system is still widely used in school and undergraduate teaching and by researchers (Peel, Finlayson and McMahon, 2007). Here is how it works, and how to classify a city yourself.
Who was Wladimir Köppen?
Köppen was born in St Petersburg on 25 September 1846 and died in Graz, Austria, on 22 June 1940 (Encyclopedia.com, Complete Dictionary of Scientific Biography). His 1870 doctoral dissertation was on heat and plant germination, and he kept revising his climate scheme, with major revisions up to 1939 (same source).
He published a first map of climatic zones in 1884, and the system named after him took shape around 1900. Late in life he worked with the climatologist Rudolf Geiger, who went on modifying the system after Köppen's death (Wikipedia).
Why did Köppen use vegetation to draw climate zones?
In Köppen's time there was very little observed climate data, so plants served as a record of climate. Peel and colleagues write that his 1900 map owed much to Grisebach's global vegetation map of 1866 and to Köppen's own background in plant science (Peel et al., 2007). They add that it is "inconceivable" he could have produced it without landscape signals of climate, particularly vegetation.
The idea was to find numbers that trace the edges plants already draw. One example: the northernmost limit of tree growth is well defined by the temperature of the warmest month (Encyclopedia.com). That is why 10°C in the hottest month separates treeless tundra from climates warm enough for forest.
What are the five Köppen climate groups?
The criteria below are from Table 1 of Peel et al. (2007), which follows Köppen's 1936 version except that it puts the temperate–cold boundary at 0°C instead of Köppen's −3°C.
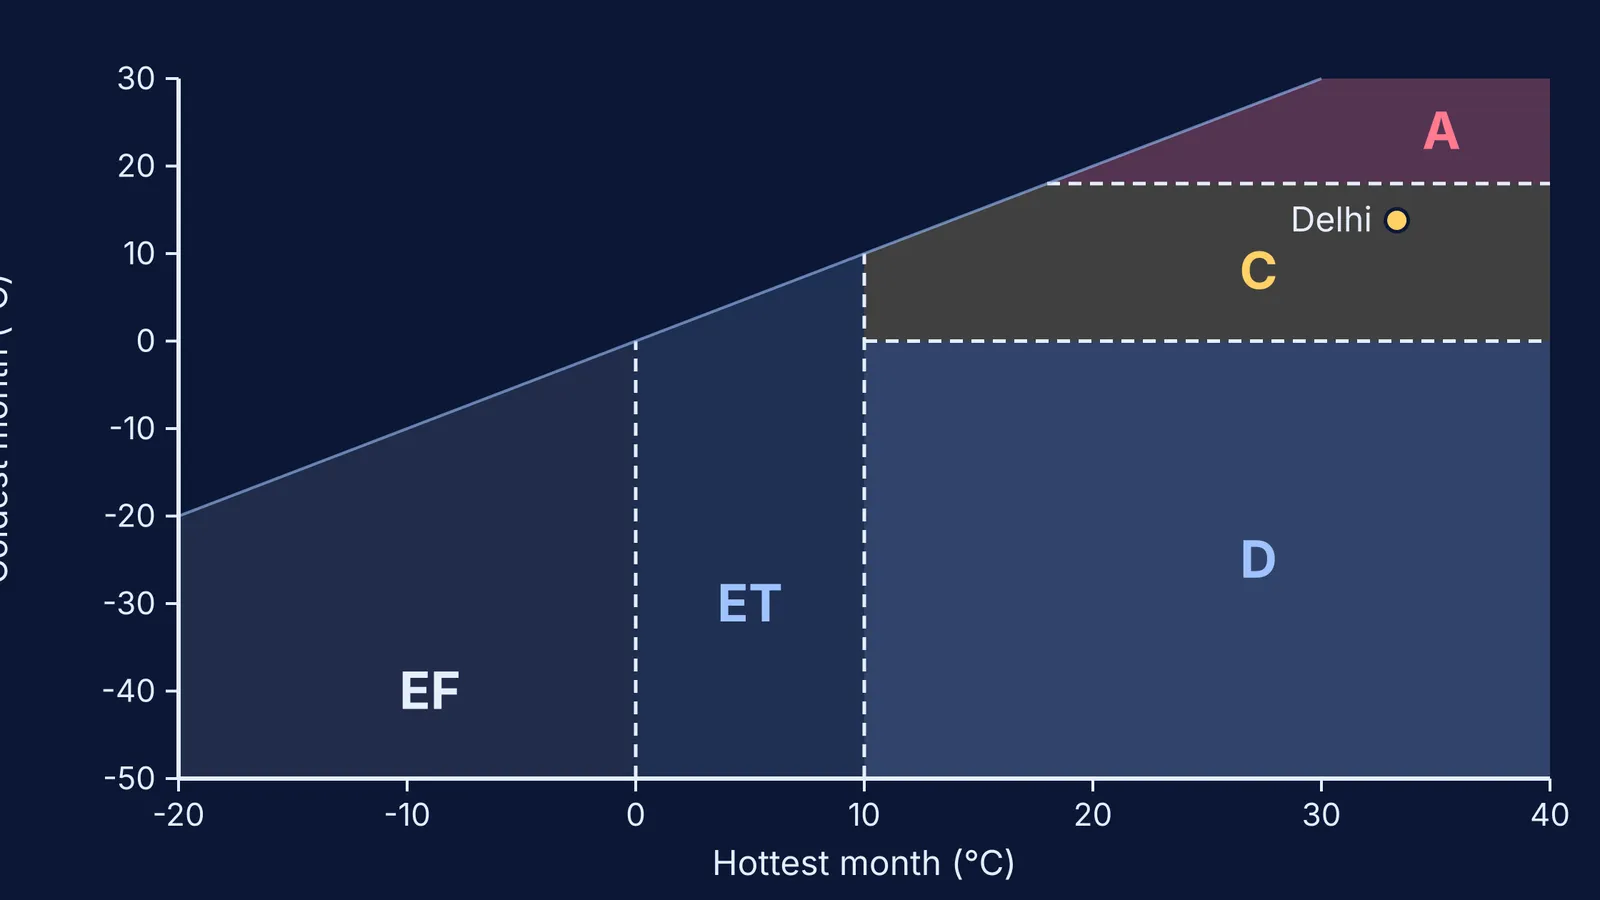
A, tropical: the coldest month averages 18°C or more.
B, arid: yearly rainfall is below a threshold that rises with temperature, because heat evaporates water faster. B is tested first.
C, temperate: hottest month above 10°C, coldest month between 0°C and 18°C.
D, cold: hottest month above 10°C, coldest month 0°C or below.
E, polar: hottest month below 10°C; ET (tundra) if it is above 0°C, EF (ice cap) if not.
A second letter gives rainfall timing (for example w for a dry winter, or S for steppe in B) and a third gives heat (a for a hot summer, h for hot arid). The 2007 scheme has 30 possible types.
How do you work out a city's Köppen climate?
Try it with New Delhi. The 1991–2020 India Meteorological Department normals for Safdarjung, on Wikipedia's Climate of Delhi page, give a yearly rainfall of 774.4 mm, a mean temperature of 25.2°C, a hottest month of 33.3°C (June) and a coldest month of 13.8°C (January). Using the Peel et al. criteria:
Find summer: the warmer of the two half-years, October–March or April–September. For Delhi it is April to September. Add that rain: 16.3 + 30.7 + 74.1 + 209.7 + 233.1 + 123.5 = 687.4 mm, which is 89% of the year's rain.
Since 70% or more falls in summer, the dryness threshold is 2 × 25.2 + 28 = 78.4 mm.
Test B: is yearly rain below 10 × 78.4 = 784 mm? Yes, 774.4 mm is. So Delhi is B.
Desert or steppe? Desert needs less than 5 × 78.4 = 392 mm. Delhi has more, so it is S, steppe.
Hot or cold? Mean temperature 25.2°C is 18°C or above, so h. Result: BSh, hot semi-arid.
Notice how close that was. Ten more millimetres of rain and Delhi fails the B test. Then a 13.8°C coldest month makes it C, a driest winter month (November, 6.0 mm) under a tenth of the wettest summer month (August, 233.1 mm) gives w, and a hottest month above 22°C gives a: Cwa, the label the same Wikipedia page uses.
If the science behind the thresholds feels shaky, the Fermi Concept Library has a lesson for every concept in physics, chemistry, biology, mathematics and computing, so you can fill the gap first.
How much of the world falls in each Köppen zone?
Using long-term records from thousands of stations, Peel et al. (2007) found the largest share of land is arid B (30.2%), followed by cold D (24.6%), tropical A (19.0%), temperate C (13.4%) and polar E (12.8%). The single most common type is BWh, hot desert, at 14.2% of land, followed by Aw, tropical savanna, at 11.5%.
A 2018 study in Scientific Data mapped Köppen-Geiger zones at 1-km resolution for 1980–2016 and projected them for 2071–2100; the authors expect the maps to be useful for modelling where species and vegetation are found (Beck et al., 2018).
For practice, run the five steps on your own city. If your answer differs from the atlas, find the threshold it sits near.