
On this page
A star's colour is a thermometer you can read from your terrace. Before any formula, try this: of a red star, a yellow star and a blue star, which is hottest? If you said red, you are in good company. On a stove or a tap, red means hot. In the sky it is the other way round, and one short formula explains why.
Why are blue stars hotter than red stars?
A star glows like a hot object: it gives off light across a spread of wavelengths, and the whole spread shifts as the temperature changes. As the OpenStax astronomy textbook puts it, "Blue colors dominate the visible light output of very hot stars (with much additional radiation in the ultraviolet)", while cool stars give off most of their visible light at red wavelengths, with more coming off in the infrared (OpenStax Astronomy 2e, Colors of Stars).
The rule behind this is Wien's displacement law: peak wavelength = b / T, where T is the surface temperature in kelvin.
Wien's constant b is 2.897 771 955... × 10⁻³ m·K, an exact value in the CODATA values published by NIST.
So the peak wavelength is inversely proportional to temperature: double the temperature and the peak wavelength halves. The same OpenStax chapter notes that the hottest stars are over 40,000 K and the coolest about 2,000 K: more than 20 times hotter, so peaks more than 20 times shorter.
How do you use Wien's law to rank stars by colour?
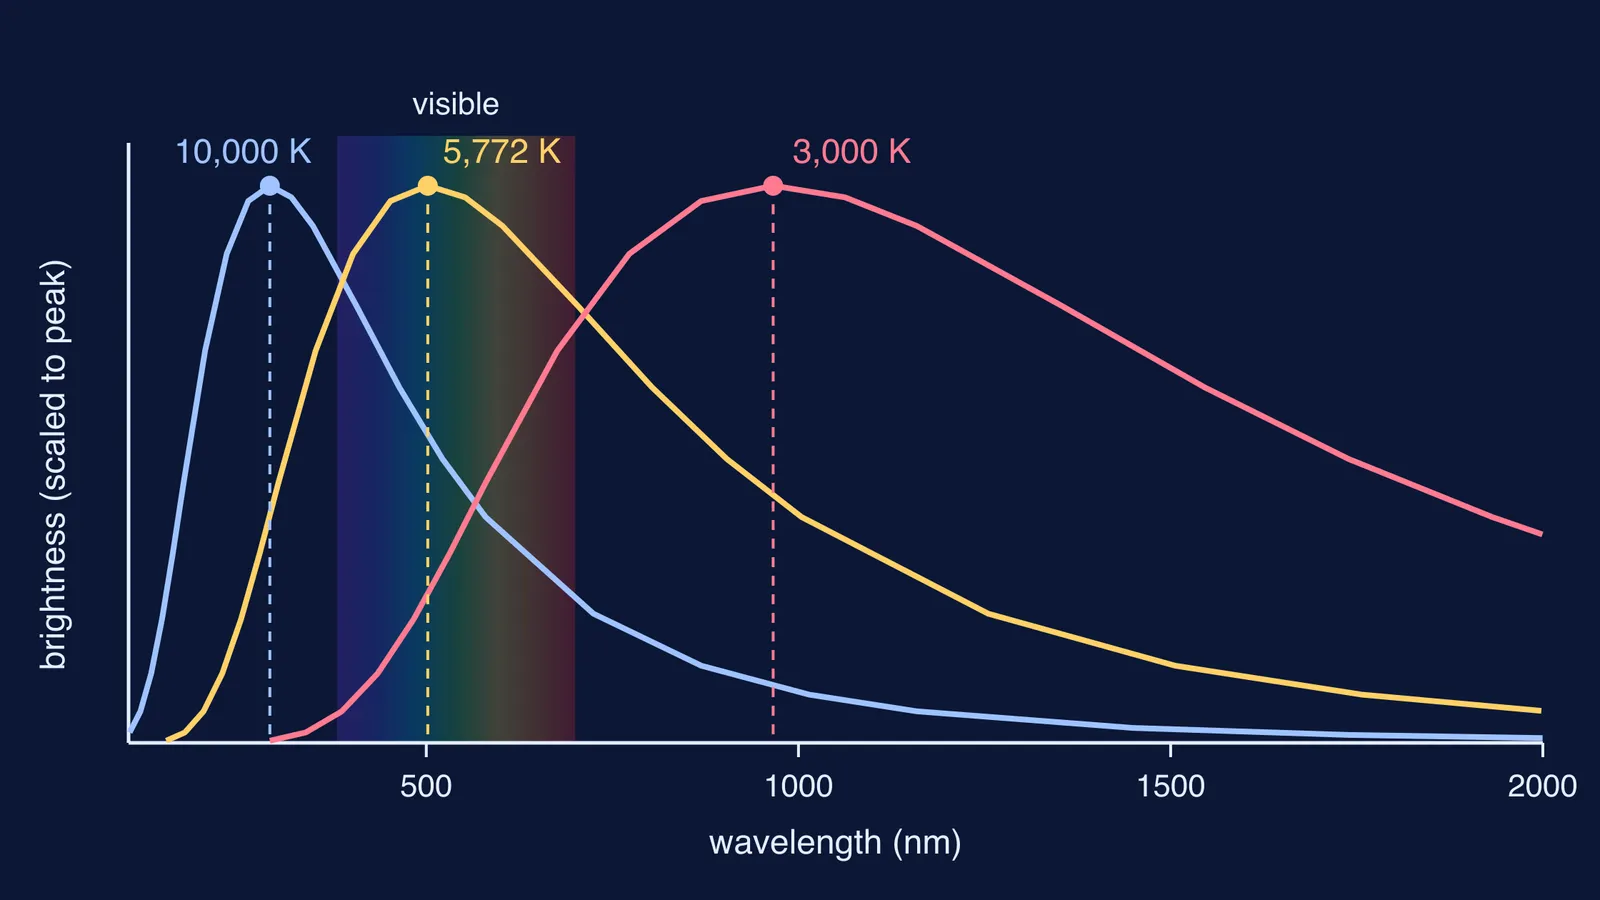
OpenStax lists an approximate temperature for an example star of each colour (OpenStax table), and NASA gives the Sun's effective temperature as 5,772 K (NASA Sun Fact Sheet). Divide b by each temperature and you get:
Betelgeuse, red, about 3,000 K: peak near 966 nm, in the infrared.
Aldebaran, orange, about 4,000 K: peak near 724 nm, just past the red end.
The Sun, yellow, 5,772 K: peak near 502 nm, in the middle of the visible band.
Vega, white, about 10,000 K: peak near 290 nm, in the ultraviolet.
Spica, blue, about 25,000 K: peak near 116 nm, far into the ultraviolet.
NASA says the human eye typically detects wavelengths from 380 to 700 nanometres (NASA Science, Visible Light). For Betelgeuse, the peak sits to the right of that window, so the part you see is the rising side of the curve, tilted towards red. For Spica, the peak sits far to the left, so you see the falling tail, tilted towards blue.
A quick check you can do in your head: Spica is about 25,000 / 3,000 ≈ 8.3 times hotter than Betelgeuse, so its peak wavelength should be about 8.3 times shorter. And 966 / 116 ≈ 8.3. The inverse rule holds.
Why are there no green stars?
The Sun's peak, near 502 nm, falls in the blue-green, yet the Sun does not look green. The reason is the shape of the curve. It is broad, so when the peak sits in the middle of the visible window, the star gives off similar amounts of every visible colour, and our eyes read that mix as white or yellowish-white. OpenStax notes that in space the Sun would look white, shining with about equal amounts of reddish and bluish light (OpenStax Astronomy 2e).
So colour tells you which side of the visible window the peak lies on: red means the long-wavelength side (cool), blue the short-wavelength side (hot).
Predict, then slide: a 10-minute test
The free PhET Blackbody Spectrum simulation from the University of Colorado Boulder lets you adjust the temperature and watch the wavelength and intensity of the spectrum change (PhET Blackbody Spectrum; description on ComPADRE). Use it to test yourself, not to watch.
On paper, write your predicted peak wavelength for 3,000 K, 5,772 K and 10,000 K, and whether each peak lies inside 380 to 700 nm.
Set the slider near 3,000 K and read off the peak. Compare with your number.
Before you move the slider to about 6,000 K, say out loud where the peak will land. Doubling the temperature should halve the wavelength, to about 483 nm.
Slide on towards 10,000 K and watch the peak leave the visible window on the short-wavelength side while the whole curve grows taller.
If any prediction missed by more than about 10 per cent, find the slip: °C instead of K, metres instead of nanometres (1 nm = 10⁻⁹ m), or reading the wrong axis.
For other ideas that are easier to see than to read, the Fermi Simulation Lab has interactive simulations you can use the same predict-then-test way. If the formula still feels like a black box, Fermi's AI tutor can work out what you already know and build a plan for the session.
Where to go next?
A hotter star is not only bluer but far brighter for its size; see how a star's luminosity depends on its radius and temperature. Our blackbody radiation simulation walkthrough adds predictions for power as well as peak, and the story of how Wilhelm Wien found the displacement law shows where b / T came from.
Tonight, find one red star and one blue-white star, write down which is hotter and roughly where each peaks, and check yourself against the list above.