

On this page
A blackbody simulation gives you a temperature slider and a curve that changes as you drag it. The useful part is predicting before you drag, with one line of arithmetic per law.
What does a blackbody radiation simulation show?
A blackbody is an idealised object whose glow depends only on its temperature. The free PhET Blackbody Spectrum simulation from the University of Colorado Boulder plots that glow as intensity against wavelength, and compares it with the blackbody spectra of Sirius A, the Sun, a light bulb and the Earth. Its learning goals include describing what happens to the peak as you raise or lower the temperature, and deciding which of two glowing objects, one orange and one blue, is hotter.
How does the peak wavelength change with temperature?
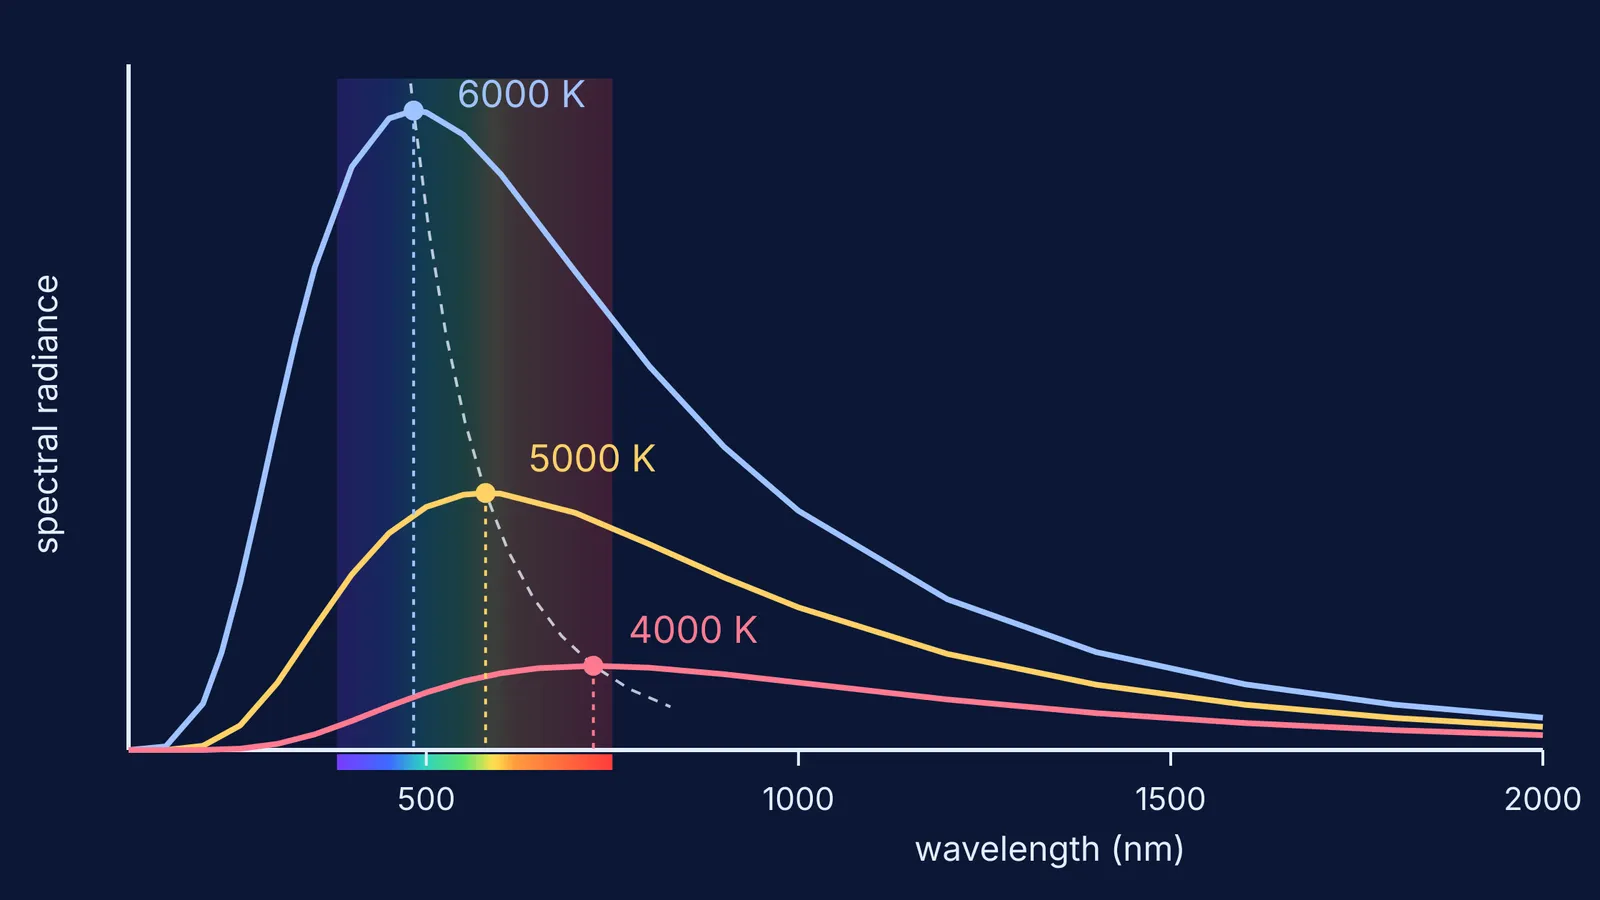
Wien's displacement law says the peak wavelength equals a constant divided by the absolute temperature: λmax = b/T. The constant b is 2.897 771 955... × 10⁻³ m K, listed as exact, in the NIST table of physical constants. Double the temperature and the peak moves to half the wavelength.
Before you touch the slider, write down your predictions. With λmax = b/T and the NIST value:
3000 K: peak near 966 nm, in the infrared
4000 K: peak near 724 nm, at the red end of the visible band
5000 K: peak near 580 nm, in the yellow
6000 K: peak near 483 nm, in the blue-green
10,000 K: peak near 290 nm, in the ultraviolet
Then set each temperature and read the peak off the graph. If your reading lands close to your prediction, the law is working.
The Sun makes a good test case. The International Astronomical Union's 2015 Resolution B3 set the nominal solar effective temperature at 5772 K, which puts the Sun's peak near 502 nm by Wien's law.
Why does total power grow as T⁴?
The Stefan-Boltzmann law says the power a blackbody radiates per square metre of surface is σT⁴, where σ is 5.670 374 419 × 10⁻⁸ W m⁻² K⁻⁴ in the NIST table. On the graph, this total is the area under the curve. As you heat the body, the curve grows taller at every wavelength as well as shifting left, so the area climbs fast.
A worked example with the NIST value:
At 3000 K: 5.67 × 10⁻⁸ × 3000⁴ is about 4.6 million watts per square metre.
At 6000 K: twice the temperature gives 2⁴ = 16 times the power, about 73 million watts per square metre.
At the Sun's 5772 K: about 63 million watts per square metre.
A 10% rise in temperature: 1.1⁴ is about 1.46, so roughly 46% more power.
The fourth line is the one to remember: a small rise in temperature makes a large rise in power.
Why do hot stars look blue and cooler ones red?
Las Cumbres Observatory's guide to black-body radiation explains that red stars are cooler and emit most strongly in red wavelengths, while hotter stars emit more blue and ultraviolet light; the Sun emits most strongly in the yellow-green. The same guide explains why there are no green stars: a star whose peak is in the green also gives out plenty of red and blue, and your eyes combine them into white.
You can see this in the simulation. At 4000 K the peak sits at the red end of the visible band, and the curve falls away towards blue. At 10,000 K the peak is in the ultraviolet, so across the visible band the blue end is brighter than the red. Colour tells you which way the curve tilts across the visible band, not only where the peak is.
How do you test both laws in the simulation?
Pick three temperatures, such as 4000 K, 5000 K and 6000 K.
For each, write the peak wavelength from b/T and the power compared with 4000 K from the Stefan-Boltzmann law, (T/4000)⁴. You should get about 2.4 times for 5000 K and 5.1 times for 6000 K.
Predict the colour: is the peak below, inside or above the visible band shown on the graph?
Move the slider and record what you see next to each prediction.
Where a prediction missed, write one sentence on why.
For practice on paper, our Stefan's law and Wien's law problems work through exam-style sums. The same predict-then-check routine works in learning waves with simulations, and what PhET research says simulations are good for covers when this kind of play helps and when it does not.
Blackbody curves are one example of an idea that is easier to see than to read. The Fermi Simulation Lab has interactive simulations for ideas like these, and Fermi's AI tutor can run a simulation with you and check your understanding as it goes.


