
On this page
Waves are hard to learn from a page because the important part is the motion. A textbook figure freezes one instant, so you have to imagine how crests move, how they add, and what changes when you turn up the frequency. A simulation shows you the motion. Watching alone is not enough, though. The useful habit is to predict first, then test.
What can a wave simulation show that a diagram can't?
The free PhET simulations from the University of Colorado cover most school wave topics. Wave on a String lets you "adjust the frequency and amplitude of an oscillator" and even watch the string in slow motion. Wave Interference lets you make waves with a dripping faucet, a speaker or a laser, add a second source to create an interference pattern, and put up barriers for single-slit and double-slit experiments. Sound Waves lets you change frequency and volume and move a listener around.
In a 2008 Science article, Carl Wieman, Wendy Adams and Katherine Perkins reported that concept mastery was measurably improved when students explored simulations in addition to traditional labs. Waves are a good place to use them because students often hold mixed ideas. Michael Wittmann, Richard Steinberg and Edward Redish found that individual students use both correct and incorrect mental models to make sense of a single physical situation involving mechanical waves. A simulation gives you a quick way to find out which model you are using.
Which four facts should you test?
These come from the OpenStax university physics textbook. Each one is something you can check on screen.
Speed, frequency and wavelength are linked: v = fλ, with frequency f = 1/T.
The medium sets the speed. On a string, speed depends on the tension and the linear mass density, not on frequency or amplitude.
Sound behaves the same way. At 20°C, sound in air travels at 343 m/s, and its speed is nearly independent of frequency. So in one medium, higher frequency means shorter wavelength.
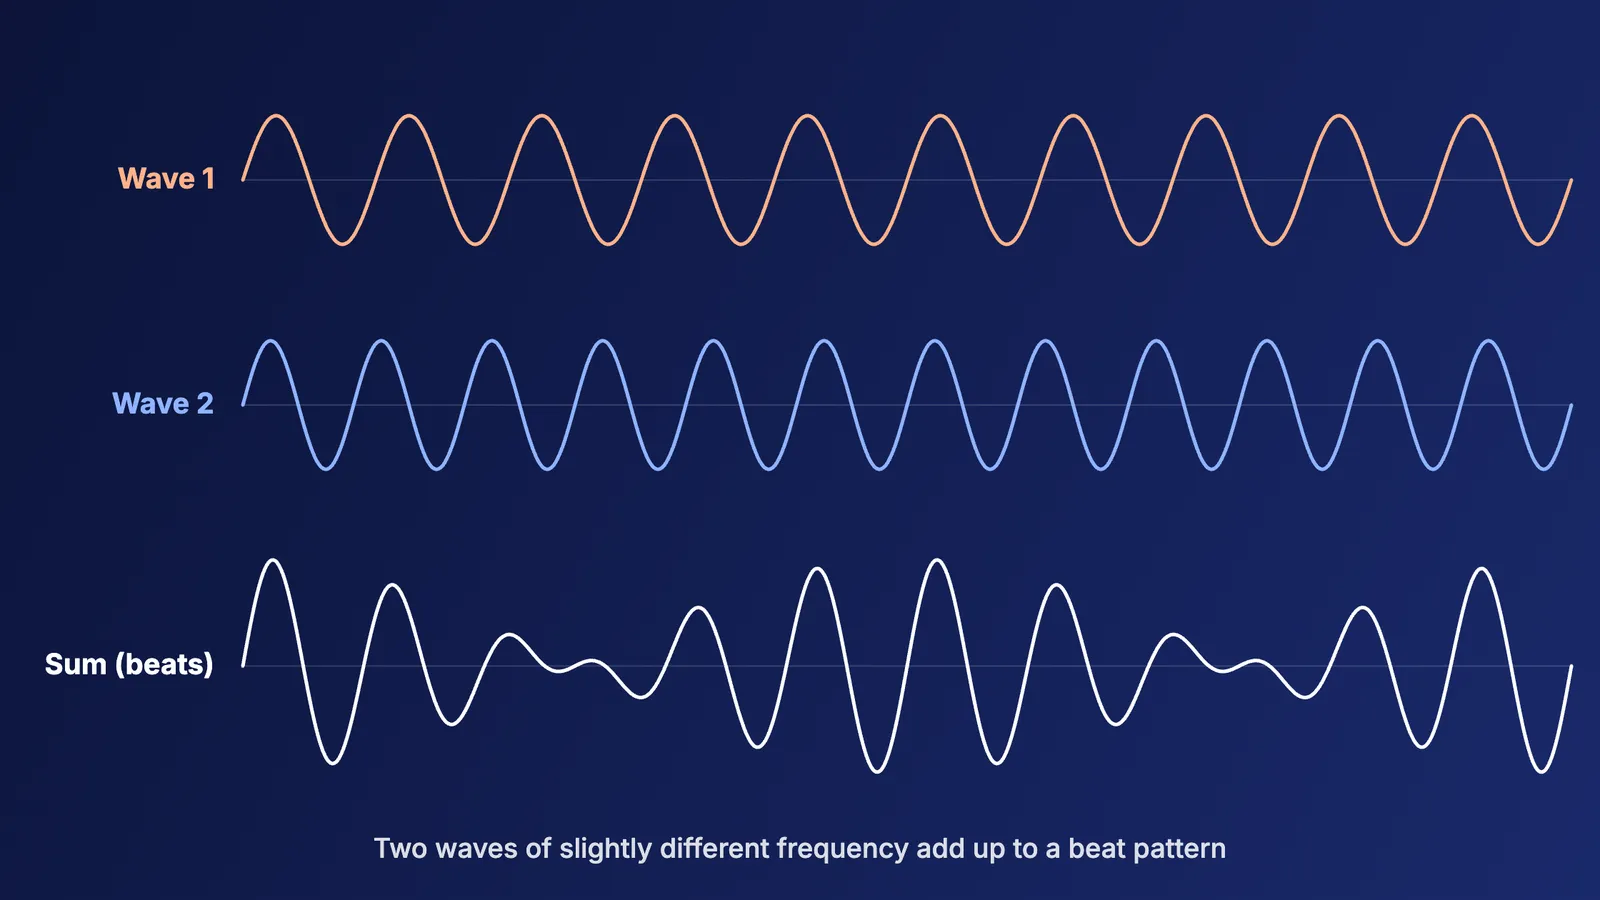
Interference depends on path difference. For two sources in step, waves add constructively when the path difference is mλ and destructively when it is (m + ½)λ.
A worked example with two speakers
Take two speakers playing the same tone in step, and sound at 343 m/s. A 343 Hz tone has λ = 343 ÷ 343 = 1 m. Stand where you are 0.5 m farther from one speaker than the other. The path difference is 0.5 m, which is half a wavelength, so the two waves cancel and you hear a quiet spot.
Now double the frequency to 686 Hz. The speed stays 343 m/s, so λ = 0.5 m. The same 0.5 m path difference is now one whole wavelength, and the quiet spot becomes a loud one. Nothing about where you stand changed; the wavelength did. Try this in Wave Interference with the speaker source: raise the frequency and watch the pattern of loud and quiet lines move closer together.
A 30-minute predict, test, explain session
Wave on a String (10 minutes). Predict: if you double the frequency, what happens to the wavelength and to the speed? Write both down. Then try it and estimate the wavelength by counting crests along the string.
Amplitude check. Predict whether a bigger amplitude makes the wave travel faster. Test it. Fact 2 says it shouldn't; see if your eyes agree.
Wave Interference (10 minutes). Add a second source. Before you look closely, sketch where you expect the quiet lines. Then raise the frequency and predict whether the lines spread out or bunch up.
Switch sources. Repeat step 3 with the laser and a double slit. The same path-difference rule produces bright and dark fringes.
Explain (10 minutes). Close the simulation and write a short paragraph explaining each result using the four facts. If you can't explain one, that is your revision target.
Common wrong ideas to check on screen
"Shaking harder sends the wave faster." Change only the amplitude and compare.
"High notes travel faster than low notes." Fact 3 says speed is nearly the same for all frequencies.
"A quiet spot means no wave reaches it." Both waves arrive; they cancel because they are out of step.
If you want more on when simulations beat diagrams, read our pieces on what PhET research says simulations are good for and choosing between simulations and static diagrams.
Where Fermi fits
The Fermi Simulation Lab has interactive simulations for ideas that are easier to see than to read, and the Fermi Concept Library has a lesson for each concept if one of the four facts above still feels shaky. Start with one prediction you are unsure about, and test it today.