On this page
Picture a bell curve with two sliders under it, one for the mean and one for the standard deviation (SD). Predict what each will do before you touch it. Then check the three percentages worth memorising against the measured heights of 10,602 American adults from a CDC national survey.
What does the mean do to the normal curve?
The mean is the centre of the bell. A location parameter such as the mean "simply shifts the graph left or right on the horizontal axis" (NIST/SEMATECH e-Handbook). Drag the mean from 160 to 175 and the whole curve slides 15 units right, with its height and shape unchanged.
A prediction to test: if every student in a class grows 2 cm, the mean rises 2 cm and the SD stays put. Adding the same amount to every value moves the curve without spreading it.
How does the standard deviation change the bell curve?
The SD controls the width. The same handbook says a scale parameter greater than one stretches the curve and one less than one squeezes it. The standard normal curve (mean 0, SD 1) peaks at about 0.4. With an SD of 3, the peak drops to about 0.13; with an SD of 1/3, it rises to about 1.2 (NIST/SEMATECH e-Handbook).
The area under the curve always stands for all the values, so a wider curve must be lower: triple the SD and the peak is a third as tall. Slide the SD towards zero and the curve becomes a spike at the mean, which is what a standard deviation of zero means. If you mix up SD and variance, see why units matter for variance and standard deviation.
What share of values lies within one, two and three SD?
Set the mean and SD to anything, shade the band from one SD below the mean to one SD above, and guess the share of area inside. Then move both sliders and look again.
The share never changes. For any normal distribution, 68.27% of values fall within one SD of the mean, 95.45% within two SD and 99.73% within three SD (NIST/SEMATECH e-Handbook). The sliders change where the band sits and how wide it is in centimetres or marks, never the fraction inside it.
Does real height data follow the 68-95-99.7 rule?
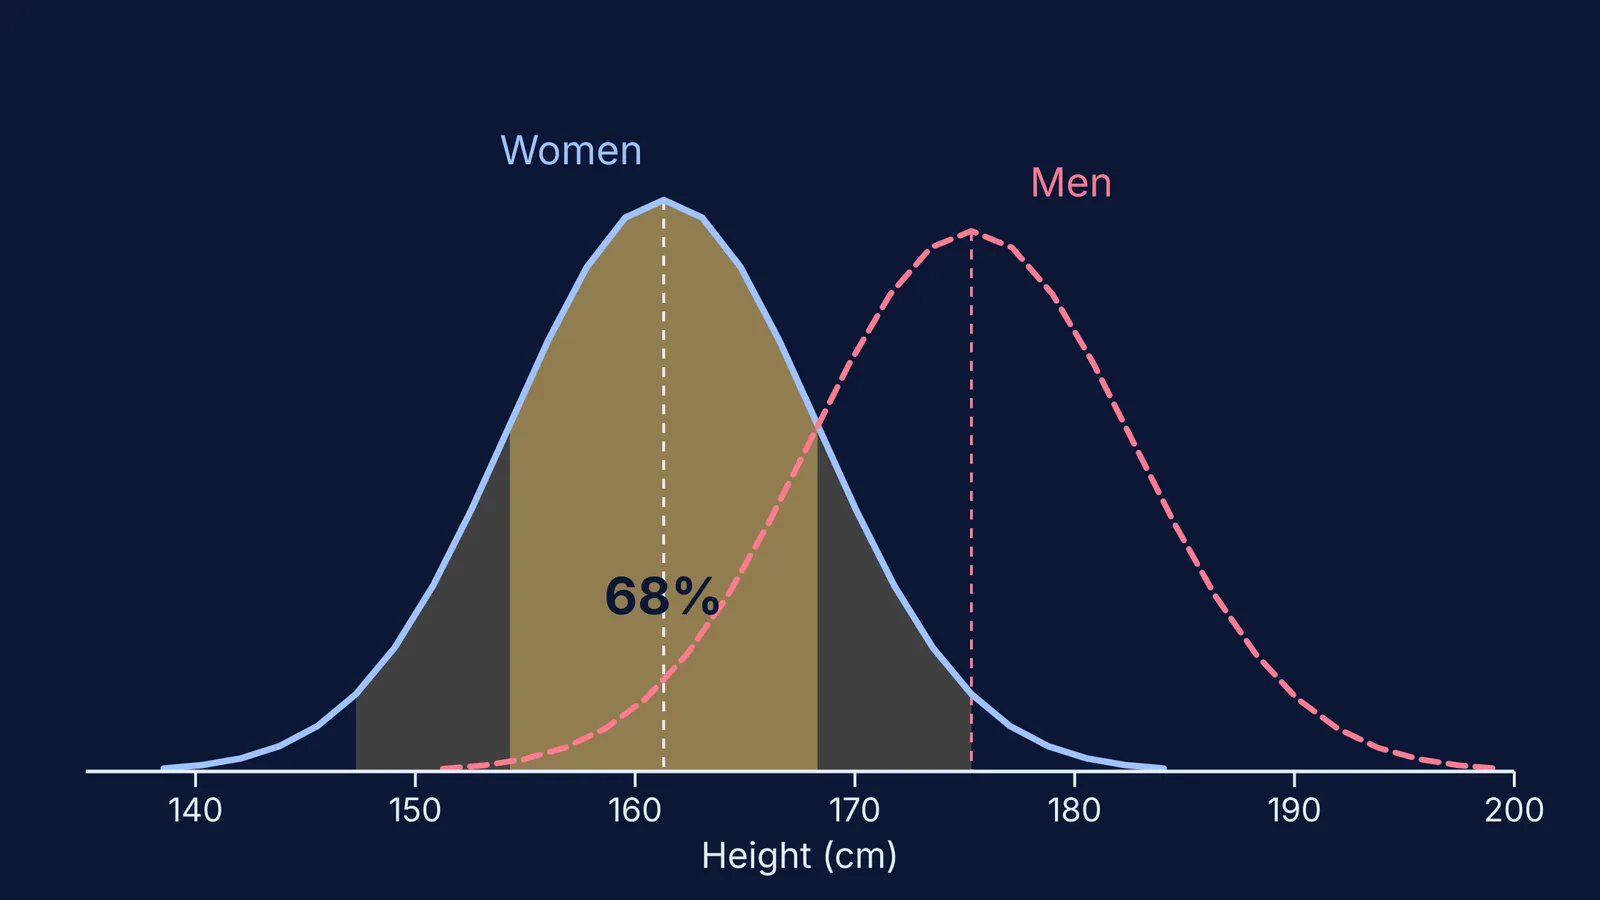
In its 2015-2018 national survey, the US National Center for Health Statistics measured 5,510 women and 5,092 men aged 20 and over, and published the mean and nine percentiles for each (CDC NCHS, Vital and Health Statistics Series 3, No. 46). For women, the mean was 161.3 cm; the 15th and 85th percentiles were 153.9 and 168.4 cm; the 5th and 95th were 149.8 and 172.5 cm.
On a normal curve, the 85th percentile sits 1.04 SD above the mean and the 95th about 1.645 SD above it (NIST normal table). So:
Estimate the SD. The 15th-to-85th band is 2.08 SD wide and 168.4 - 153.9 = 14.5 cm wide, so the SD is about 14.5 / 2.08 = 7.0 cm.
Predict the tails: 161.3 plus or minus 1.645 x 7.0 gives 149.8 cm and 172.8 cm.
Compare: the survey measured 149.8 cm and 172.5 cm, within 3 mm.
Read off the bands: about 154 to 168 cm should hold 68% of women, and 147 to 175 cm should hold 95%.
The men's figures in the same report work the same way (CDC NCHS). Their mean is 175.3 cm and their SD comes out at about 7.4 cm. That predicts 5th and 95th percentiles of 163.1 cm and 187.5 cm, against measured values of 162.8 cm and 187.4 cm. So the men's curve is almost the women's curve with the mean slider moved 14 cm to the right.
One caution: the fit holds because the two groups were kept separate. Mix them in one histogram and you get a wider hump that blends two curves, so don't apply the rule blindly. Check the shape first (how a histogram groups values into classes helps here).
A five-minute slider plan for revision
Fix the SD and drag the mean. Say what changes (position) and what does not (shape, peak height).
Fix the mean and double the SD. Predict the new peak height before you look.
Shade the bands at 1, 2 and 3 SD and write the three shares from memory.
Pick a real dataset, such as heights in your class or marks in a unit test. Work out the mean and SD, then count the values within one SD. With 40 students, the 68.27% figure predicts about 27.
If your count is far off, look at the histogram for a lopsided shape or two humps before you blame your arithmetic.
We built the Fermi Simulation Lab for interactive simulations of ideas that are easier to see than to read, and the bell curve is one of those ideas. If you get stuck on step 4, Fermi's AI tutor works out what you already know, builds a plan for the session and checks your understanding as it goes.