On this page
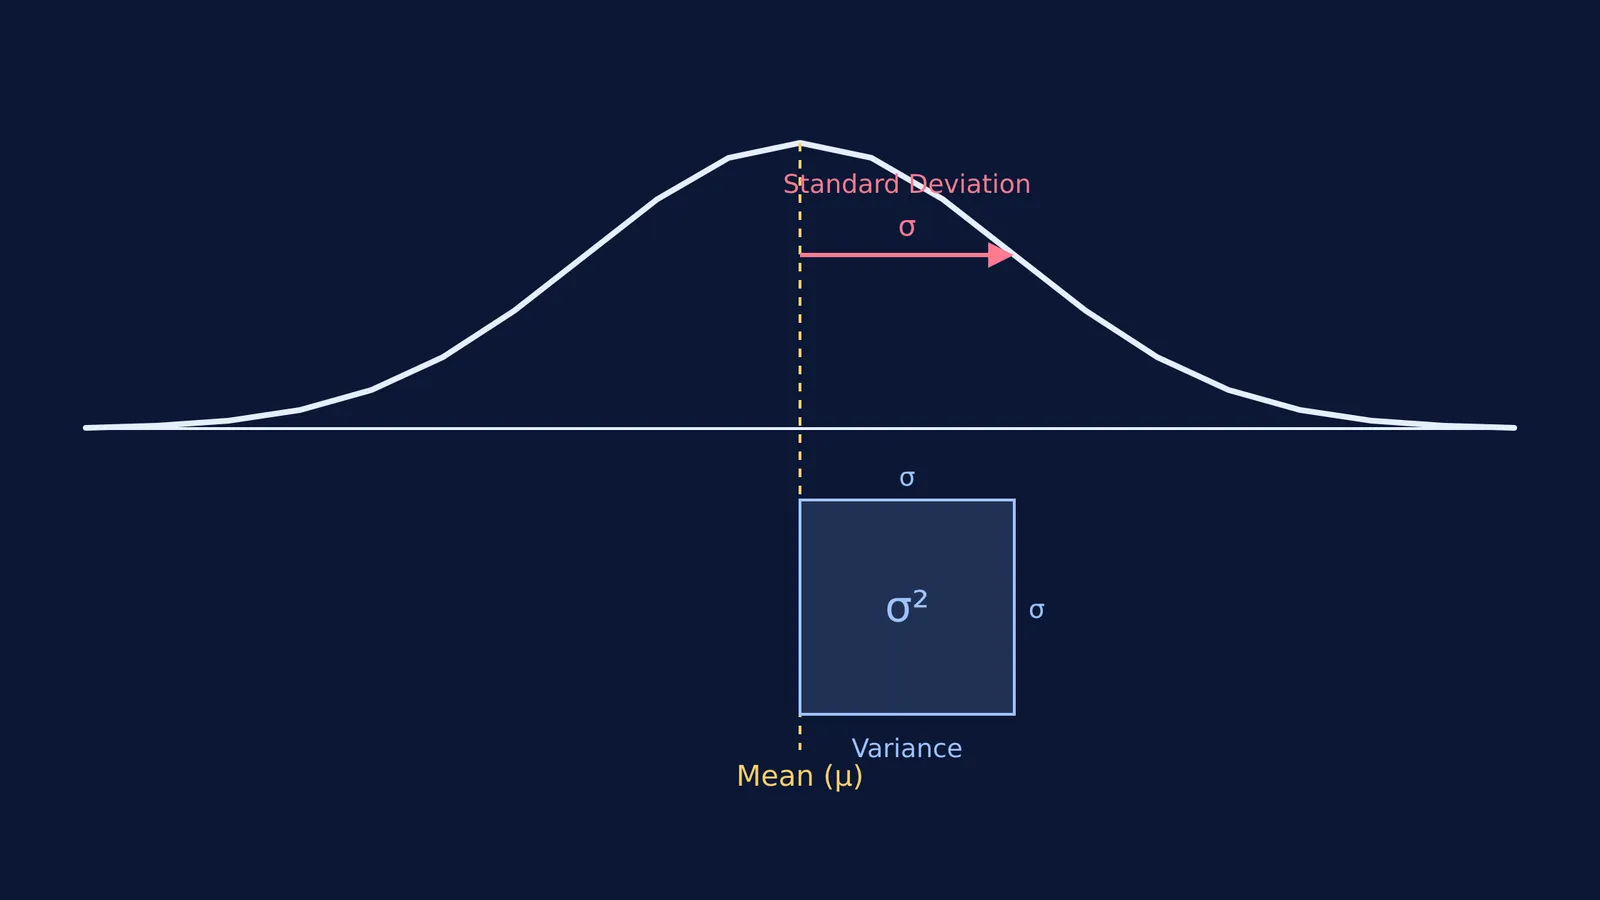
When calculating the spread of a dataset—such as test scores, heights or temperatures—you will encounter both variance (σ²) and standard deviation (σ). Since standard deviation is simply the square root of variance, it might seem redundant to have two names for the same core idea.
However, they serve very different purposes. Standard deviation is preferred for reporting because it matches the original data's scale, while variance is mathematically cleaner for theoretical calculations.
Why use standard deviation instead of variance?
The main reason standard deviation is used in most everyday applications is its units. According to Wikipedia, the variance of a variable has units that are the square of the units of the variable itself.
For example, if you measure the heights of students in centimetres, the mean height will be in centimetres. The standard deviation will also be in centimetres—making it easy to say, "The average height is 165 cm, with a standard deviation of 5 cm."
Variance, on the other hand, squares these differences. The variance for that same class would be 25 cm² (25 square centimetres). It is much harder to visualize what a "square centimetre of height" means in the real world. Because standard deviation shares the same units as the mean, you can directly add or subtract it from the mean to find meaningful ranges.
What does a standard deviation of 0 mean?
A standard deviation of zero indicates that there is no variation in the data set, according to Wikipedia.
If you calculate a standard deviation of zero, it means every single value in your dataset is exactly identical to the mean. For example, if a group of five students all score exactly 80 marks on a test, the mean is 80. Since no score deviates from this mean, the variance is 0, and the standard deviation is 0.
If your data is plotted on a graph, a standard deviation of zero means all your data points fall on exactly the same spot.
The Empirical Rule and standard deviation
Standard deviation is also the key to the Empirical Rule (or the 68–95–99.7 rule) for normal distributions. This rule states that approximately 68.27% of values fall within one standard deviation of the mean, 95.45% within two standard deviations, and 99.73% within three, according to Wikipedia.
Variance cannot be used directly in this rule. You must take the square root of the variance first before you can determine what percentage of the data falls within a certain range.
When do we use variance vs standard deviation?
If standard deviation is so intuitive, why do mathematicians and statisticians use variance?
Variance has superior mathematical properties that make it essential for proofs and complex formulas. The most important of these properties is additivity. If you have two independent variables, the variance of their sum is equal to the sum of their individual variances: Var(A + B) = Var(A) + Var(B), as noted on Wikipedia.
Standard deviations do not add together this way. Because of this, variance is the foundational metric used in probability theory, Analysis of Variance (ANOVA), and regression models. You do the heavy mathematical lifting with variance, and then take the square root at the very end to report the standard deviation.
Worked example: Adding variances
Imagine you have a commute to school broken into two independent parts: taking a bus and then walking.
Bus journey: mean time = 20 minutes, standard deviation = 3 minutes.
Walking: mean time = 10 minutes, standard deviation = 4 minutes.
To find the standard deviation of your total commute, you cannot just add 3 + 4 = 7 minutes. You must convert to variance first:
Variance of bus = 3² = 9
Variance of walking = 4² = 16
Total variance = 9 + 16 = 25
Total standard deviation = √25 = 5 minutes.
Your total commute has a standard deviation of 5 minutes, not 7 minutes. This is why variance is mathematically essential.
If you get stuck on how to apply these rules in your homework, the Fermi Concept Library covers every concept in mathematics, each with its own lesson and its place in the map. You can also review how to set up algebraic ranges in our guide to equations and inequalities with modulus or look at finding patterns in mathematical series like finding Aⁿ for a matrix.