

On this page
In statistics, the standard deviation measures how spread out numbers are from their average value.
If you are looking at a dataset and wondering what a standard deviation of zero means, the answer is simple: there is no spread at all.
What does a standard deviation of zero mean?
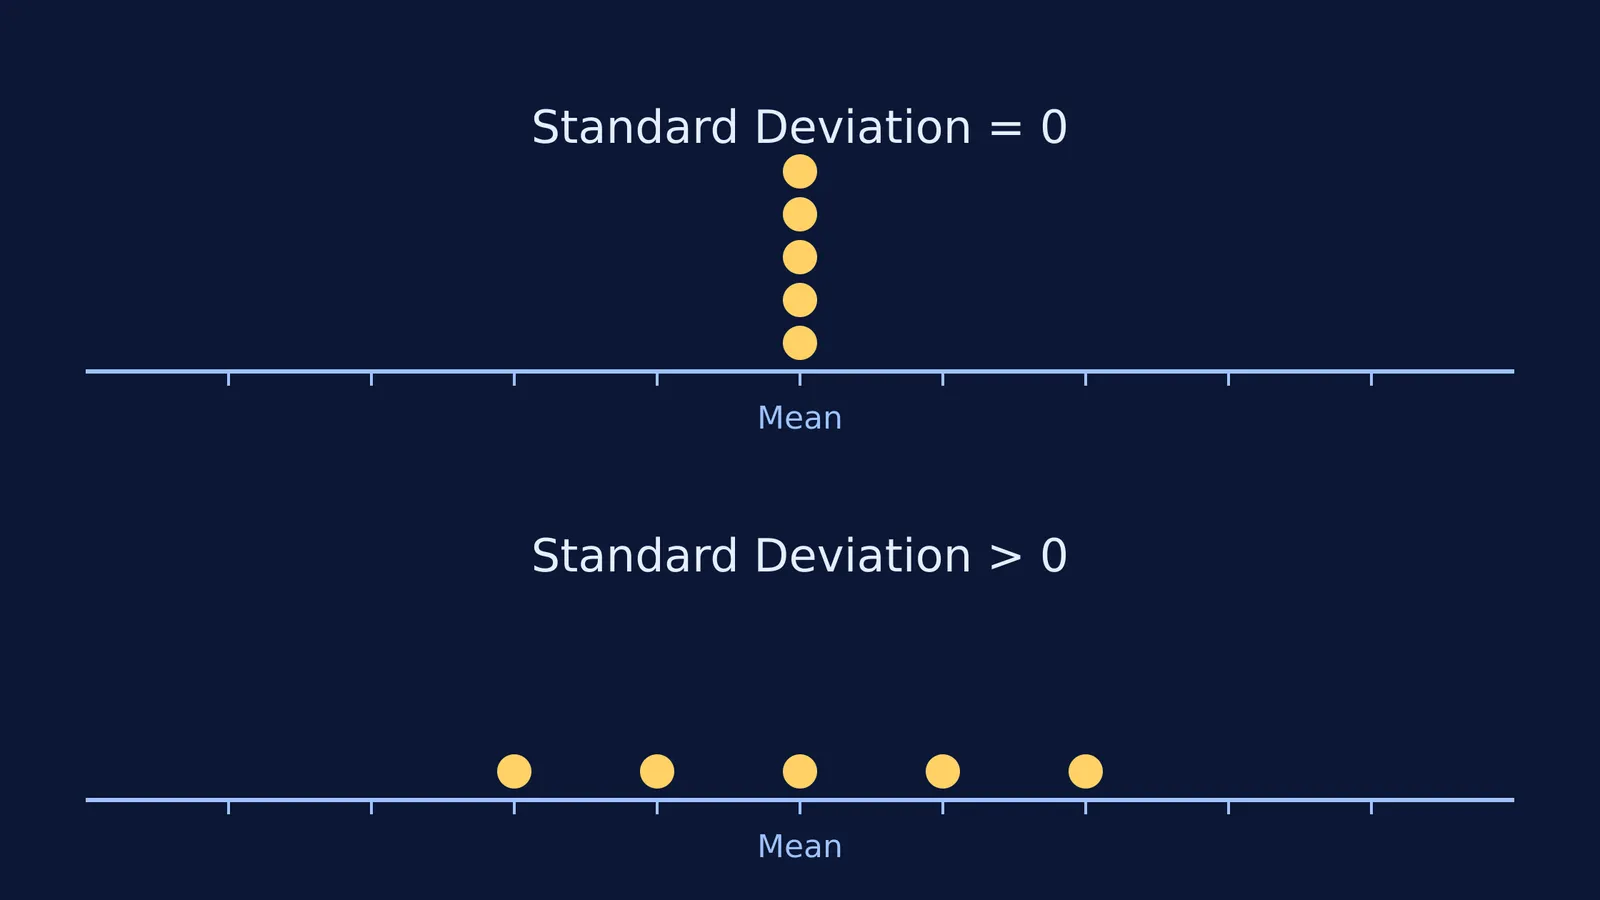
A standard deviation of zero means that every single value in a dataset is exactly the same (Maths Is Fun).
Because standard deviation measures the distance of data points from the mean, a value of zero indicates that no data point deviates from the mean. For example, if a group of five students all score exactly 80 on a test, the dataset is {80, 80, 80, 80, 80}. The mean is 80, and the distance of every score from the mean is zero.
When you study how adding to or scaling data changes the mean and variance, you will see that adding a constant to every identical value shifts the mean, but the standard deviation remains zero because the values are still identical to one another.
Why can a standard deviation never be negative?
Standard deviation cannot be negative because it is calculated as the positive square root of the variance, and the variance is the average of squared differences from the mean (Maths Is Fun).
To understand why we square the differences, consider a dataset with spread, such as {2, 6}.
The mean is 4.
The differences from the mean are (2 − 4) = −2 and (6 − 4) = 2.
If we simply added these differences, the negative would cancel the positive, giving zero.
To solve this, we square the differences: (−2)² = 4 and 2² = 4.
The variance is the average of these squares, which is 4. The standard deviation is the square root of 4, which is 2. Because squaring any real number always produces a positive number or zero, the variance is always zero or positive. The principal square root of a non-negative number is also zero or positive, meaning the standard deviation can never be negative.
If you need help working through variance calculations, the Fermi Problem Library has worked problems with a step-by-step solver that explains the reasoning rather than printing an answer.
How do you get a sense of scale for data spread?
When the standard deviation is greater than zero, it gives you a quick ruler to measure the spread of the data.
For data that follows a normal (bell-shaped) distribution, the empirical rule—often called the 68-95-99.7 rule—provides a clear sense of scale (Maths Is Fun):
68% of the data falls within 1 standard deviation of the mean.
95% of the data falls within 2 standard deviations of the mean.
99.7% of the data falls within 3 standard deviations of the mean.
If a school's average height is 160 cm with a standard deviation of 5 cm, you know immediately that about 68% of the students are between 155 cm and 165 cm. By the time you move 3 standard deviations away (145 cm to 175 cm), you have captured almost the entire school.
Different measures of spread tell you different things. While standard deviation squares the distances, the mean absolute deviation about the median takes the absolute value of the distances, which is less sensitive to extreme outliers. If you want to explore how these different metrics connect, the Fermi Concept Library holds every concept in physics, chemistry, biology, mathematics and computing, each with its own lesson and its place in the map.


