
On this page
The menstrual cycle graph looks like four tangled lines, so most students memorise it as a picture. It is easier to read as a story in which one hormone sets off the next. Here you will move through it day by day, predicting each peak before you check.
What does the menstrual cycle hormone graph show?
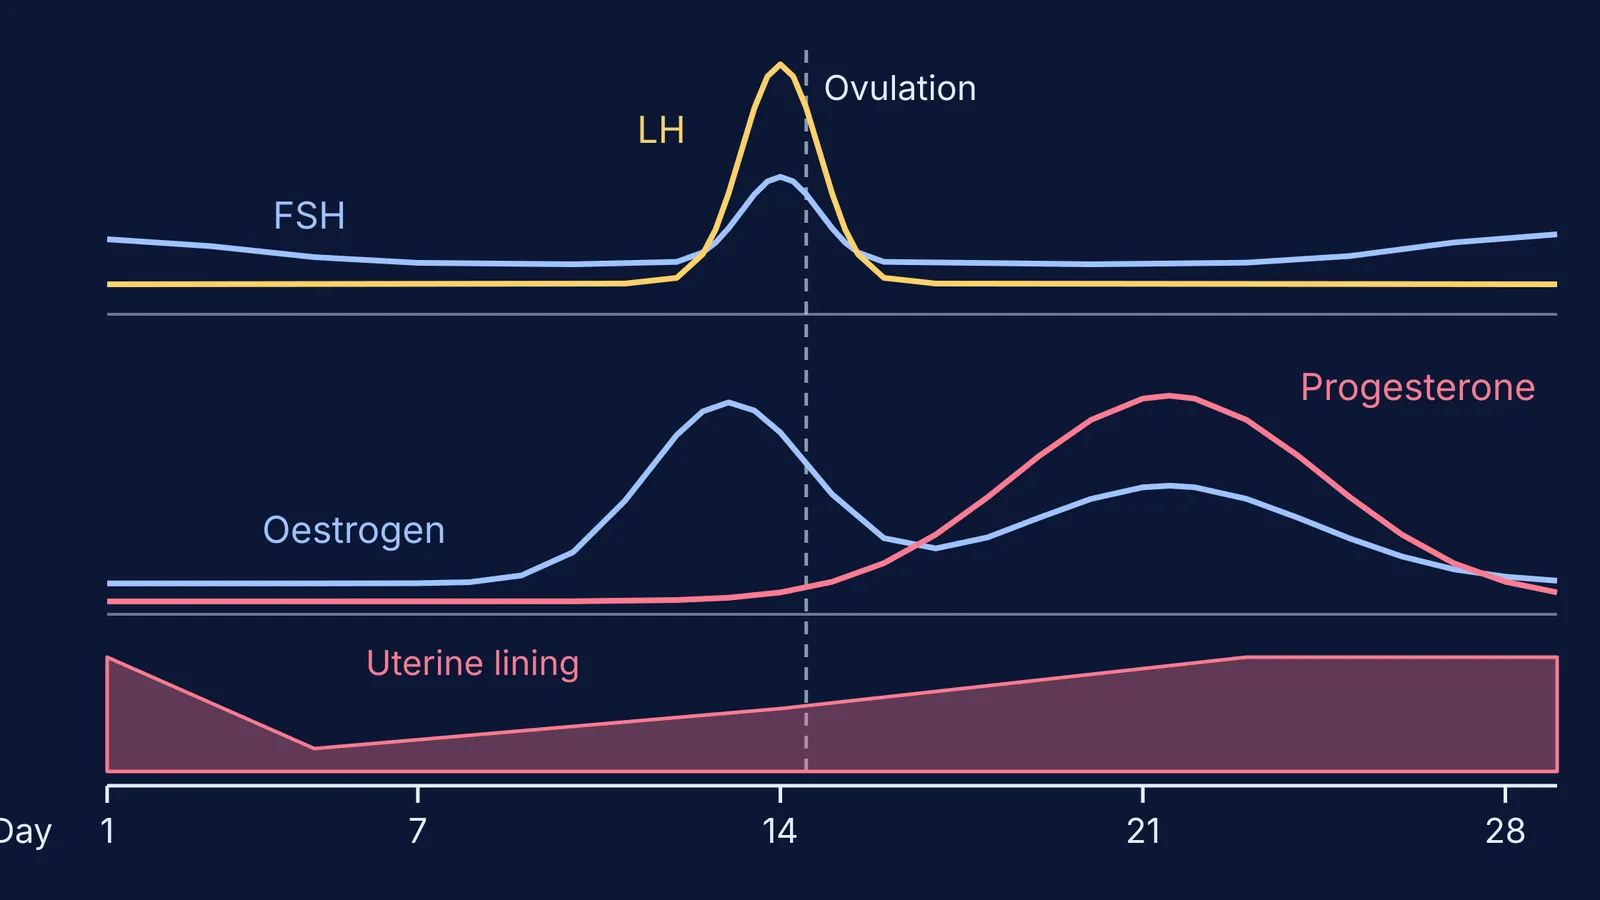
The standard diagram is Figure 2.9 in the NCERT Class 12 Biology chapter on human reproduction. It stacks four bands that share one time axis: pituitary hormones (FSH and LH), what is happening in the ovary, ovarian hormones (oestrogen and progesterone), and the uterine lining, called the endometrium. NCERT says menstruation comes round about every 28 or 29 days on average, and that the bleeding phase lasts 3-5 days.
Pituitary hormones act on the ovary, and ovarian hormones act on the uterus. Hold on to that chain and the graph stops looking random. For the full list of what the front lobe of the pituitary makes, see our post on anterior pituitary hormones and their targets.
When do FSH, LH, oestrogen and progesterone peak?
Imagine a slider under NCERT's Figure 2.9. Drag it from day 1 to day 28 and stop at five points:
Days 1-5 (menstrual phase): the lining is shed. Oestrogen and progesterone are low.
Days 6-13 (follicular, or proliferative, phase): NCERT says LH and FSH rise gradually and make a follicle grow. The follicle makes oestrogen, and oestrogen rebuilds the lining.
Just before day 14 (oestrogen peak): a clinical chapter on documenting ovulation explains that oestradiol staying above 200 pg/mL for about 50 hours sets off the LH surge. It cites a World Health Organization study, which found that oestradiol peaked a median of 24 hours before ovulation.
About day 14 (LH and FSH peak): NCERT says the LH surge makes the mature Graafian follicle burst and release the egg. In the WHO study, the LH peak came a median of 16.5 hours before ovulation.
Days 15-28 (luteal, or secretory, phase): the leftover follicle becomes the corpus luteum. NCERT says it secretes large amounts of progesterone, which maintains the lining. Progesterone peaks about a week after ovulation, around day 21-22 in NCERT's figure, and oestrogen has a smaller second rise.
To see where the follicle and corpus luteum sit, use our labelled ovary section diagram. Our post on what the gonad hormones do covers oestrogen and progesterone more widely.
Predict, then check: a five-minute drill
Rereading the graph does not test you, but predicting before you look does. Cover the graph and answer these out loud:
Slider at day 10: which ovarian hormone is climbing, and what is it doing to the lining?
Slider at day 13: what has to happen to oestrogen before LH can surge?
Slider at day 14: which line has the tallest, narrowest peak, and what does it trigger?
Slider at day 21: which hormone is highest, and which structure is making it?
Slider at day 27: why are both ovarian hormones falling?
Now uncover the graph and mark your answers. For each one you got wrong, write down the missing link in the chain, such as "the corpus luteum makes progesterone".
The Fermi Simulation Lab has interactive simulations for ideas that are easier to see than to read. To talk through this graph instead, Fermi's AI tutor can draw the figure and check your understanding as it goes.
Why does the lining break down if there is no pregnancy?
NCERT explains that if the egg is not fertilised, the corpus luteum degenerates. Without its progesterone, the endometrium breaks down, and that is menstruation. In pregnancy the cycle stops. Exams test this link: the bleeding is caused by falling progesterone, not by rising FSH.
Is ovulation always on day 14?
No. Day 14 is the textbook model, so use it in exams. A 2019 study in npj Digital Medicine analysed 612,613 ovulatory cycles logged in an app, with the day of ovulation estimated from body temperature. Only 13% of cycles were exactly 28 days, and the average was 29.3 days. The average follicular phase lasted 16.9 days and the average luteal phase 12.4 days. Differences in cycle length came mostly from the first half. In 25-30 day cycles, the follicular phase (from day 1 to the estimated day of ovulation) averaged 15.2 days.
If your periods are very irregular, very painful or stop altogether, see a doctor or gynaecologist rather than relying on an app or a graph.
Tonight, do the five-question drill with the graph covered, then repeat it two days later.