On this page
You can estimate Planck's constant with three LEDs, a voltmeter and a graph. The idea fits on one line: an LED starts to glow when the energy each electron gains from the voltage, eV, is enough to make one photon, hf. Bluer light means bigger photons, so bluer LEDs need more voltage. Here is how to predict those voltages, plot them, and read Planck's constant from the slope.
How does an LED let you find Planck's constant?
A review in the Mapana Journal of Sciences describes the LED method as based on the 'Inverse Photoelectric Effect': current flows only above a minimum turn-on voltage, and at that point the electron energy eV equals the photon energy hf (Venkatreddy and colleagues, Mapana Journal of Sciences). The same review credits P J O'Conner and L R O'Conner with proposing the LED method in 1974 and says it became popular because of its simple principle and affordable equipment.
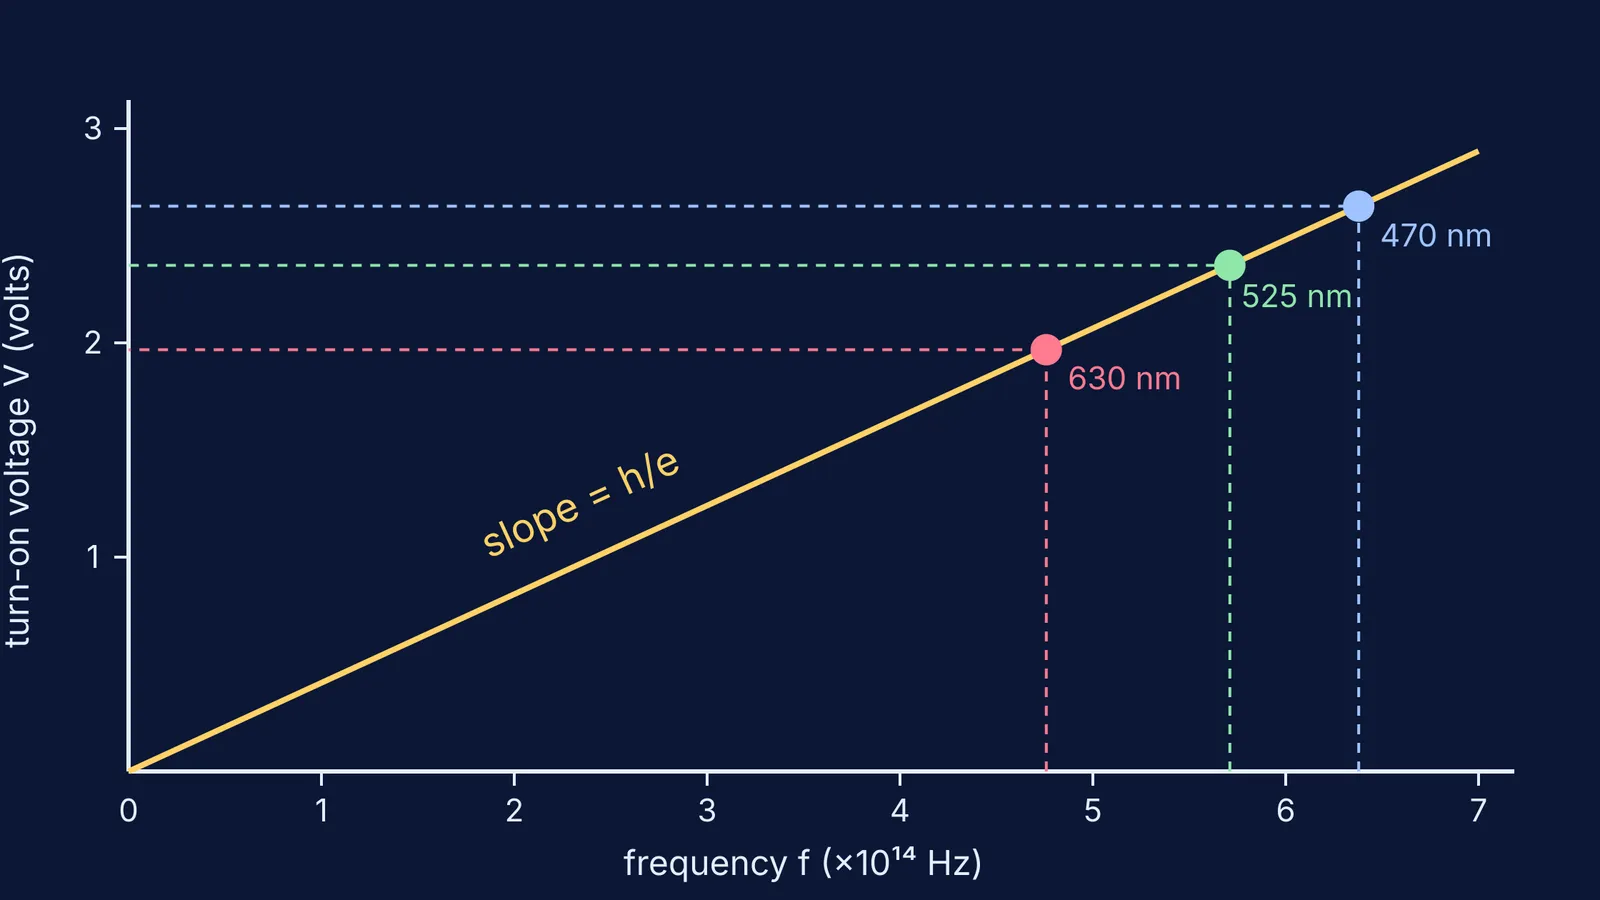
Rearranged, eV = hf becomes V = (h/e) f. In this ideal picture that is a straight line through the origin with slope h/e.
The Planck constant is exactly 6.62607015 × 10⁻³⁴ J Hz⁻¹ in the SI (NIST).
The elementary charge is exactly 1.602176634 × 10⁻¹⁹ C (NIST).
If you want the photoelectric version of the same graph first, read why the slope of the stopping potential vs frequency graph is h/e.
What turn-on voltage should red, green and blue LEDs have?
Predict before you measure. Using f = c/λ and the exact values of h and e from NIST, the ideal turn-on voltage is V = hc/(eλ), which works out to about 1239.8 divided by the wavelength in nanometres. For three typical LED colours:
Red, 630 nm: f = 4.76 × 10¹⁴ Hz, predicted V = 1.97 V
Green, 525 nm: f = 5.71 × 10¹⁴ Hz, predicted V = 2.36 V
Blue, 470 nm: f = 6.38 × 10¹⁴ Hz, predicted V = 2.64 V
Write these down. The gap between prediction and reading is where the learning happens.
How do you plot voltage against frequency and get h?
Here is a worked example with made-up readings of the kind you might take by eye, a little below the ideal values.
Record the turn-on voltage for each colour: red 1.85 V, green 2.22 V, blue 2.50 V.
Convert each wavelength to frequency with f = c/λ (the values listed above).
Plot V on the y-axis against f on the x-axis, with the origin included so you can see where the line heads.
Draw the best-fit straight line. A least-squares fit to these three points gives a slope of 4.00 × 10⁻¹⁵ V s.
Multiply by e: h ≈ 4.00 × 10⁻¹⁵ × 1.602 × 10⁻¹⁹ ≈ 6.41 × 10⁻³⁴ J s.
Compare with the exact value from NIST: 6.41 against 6.63 is about 3% low.
Every reading was low, yet the slope came out close. The slope depends on how voltage changes from colour to colour, so a steady offset in every reading barely hurts it; an error that differs by colour hurts much more.
Why does the LED method sometimes give the wrong value?
The Mapana review notes that several researchers have reported unrealistic values of Planck's constant from this experiment, and that accuracy depends mainly on getting the right turn-on voltage and the right wavelength for each LED (Mapana Journal of Sciences). One approach it describes, from the O'Conners' 1974 method, is to extend the straight part of the current-voltage graph down to the voltage axis instead of judging the first glow by eye. If you have not met I-V graphs yet, see how to find the dynamic resistance of a diode from its I-V graph.
A second problem is in the LED itself. Dean Zollman and Ian Bearden point out in Physics Education that for some LEDs the energy of the emitted light can be quite different from the energy gap of the material, and these LEDs give different results for Planck's constant (Zollman and Bearden, Physics Education). So a 'bad' result is not always a bad measurement.
Building the real circuit? Read why an LED needs a series resistor first.
A five-step plan for a simulation or bench test
Write your three predicted voltages before you open anything.
Raise the voltage slowly for each colour and note where current, or light, first appears.
Plot all three points, draw the line, and calculate h from the slope.
Ask whether the line passes near the origin. If not, are all the readings shifted by a similar amount, or does one look out of place?
Change one LED's wavelength and predict where its point moves.
The Fermi Simulation Lab has interactive simulations for the ideas that are easier to see than to read. If photon energy still feels shaky, the Fermi Concept Library gives every physics concept its own lesson.