

On this page
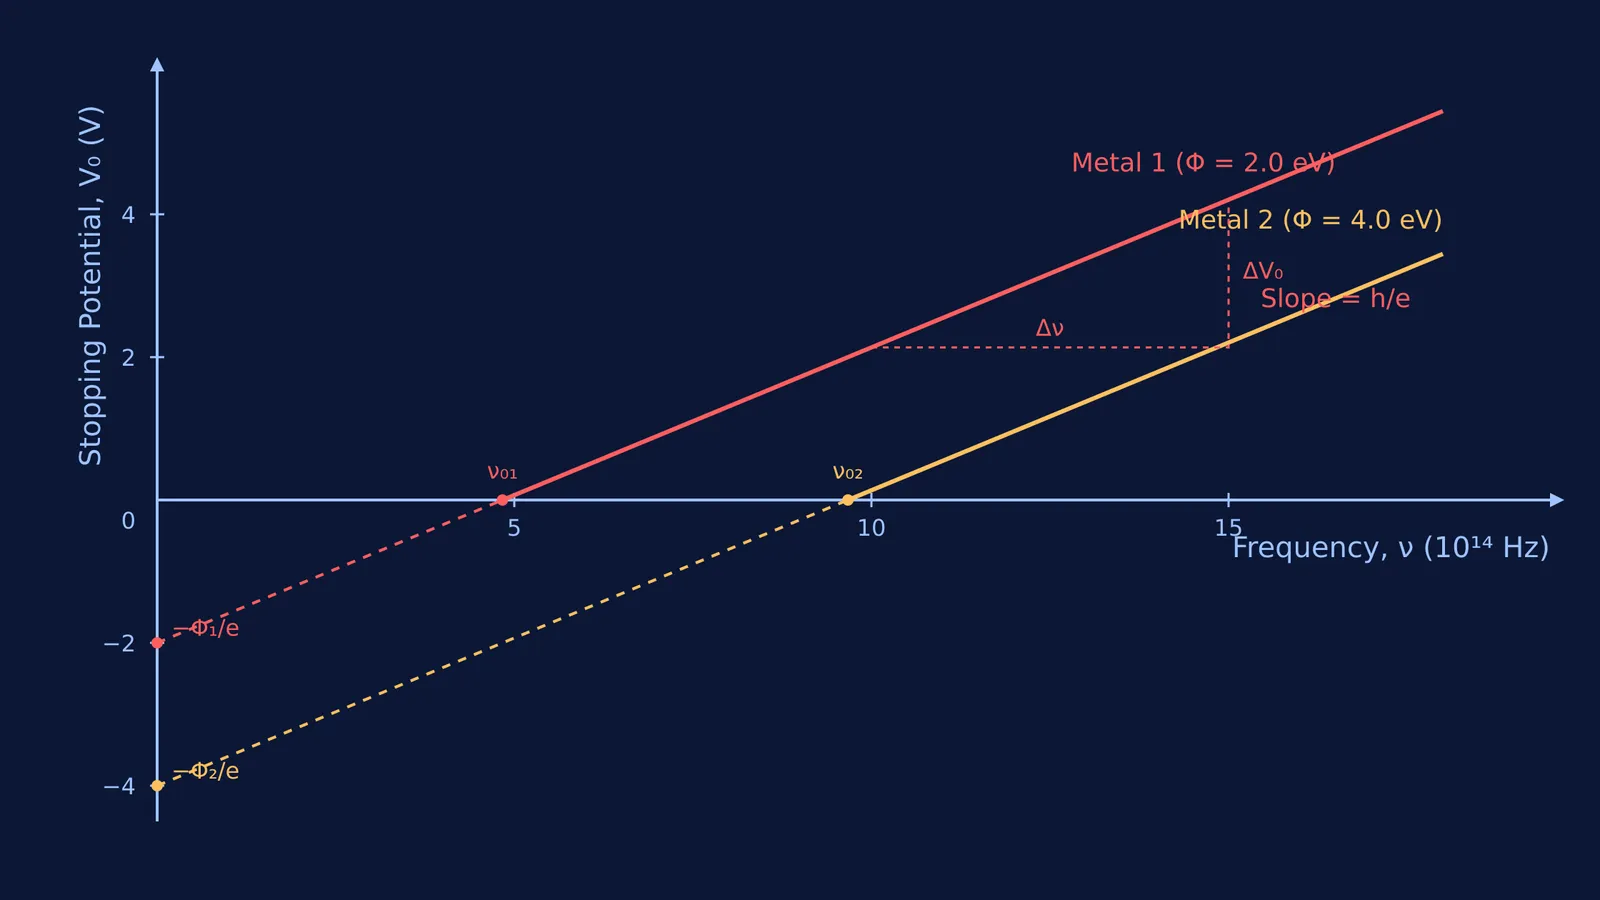
When you shine high-frequency light on a metal surface, it kicks out electrons. To stop even the fastest of these electrons from reaching a collector, you apply a negative voltage known as the stopping potential (V₀). If you plot this stopping potential against the frequency (ν) of the incoming light, you get a straight line. The geometry of this line is not random: the slope of the stopping potential vs frequency graph gives h/e, where h is Planck's constant and e is the charge of an electron.
What is the Einstein photoelectric equation?
The relationship between light and electron energy comes directly from the Einstein photoelectric equation. The IUPAC Gold Book defines this principle, which states that the maximum kinetic energy of an emitted electron (Eₖ) equals the energy of the incoming photon (hν) minus the work function (Φ) of the metal.
In equation form, this is Eₖ = hν − Φ.
Because the stopping potential V₀ is the exact voltage required to halt the fastest electron, the maximum kinetic energy can also be written as Eₖ = eV₀. Substituting this into Einstein's equation gives eV₀ = hν − Φ. Dividing the entire equation by the elementary charge e transforms it into a straight-line equation that can be plotted on a graph:
V₀ = (h/e)ν − (Φ/e)
Why is the slope of stopping potential vs frequency graph always h/e?
If you look at V₀ = (h/e)ν − (Φ/e) and compare it to the standard equation for a line in coordinate geometry, y = mx + c, the pieces match up perfectly.
The y-axis variable (y) is the stopping potential (V₀).
The x-axis variable (x) is the frequency of the incident light (ν).
The slope (m) is the ratio h/e.
Because h and e are universal constants of nature, the slope h/e is a constant for every photoelectric experiment in the universe. In SI units, h is 6.626 × 10⁻³⁴ J·s and e is 1.602 × 10⁻¹⁹ C, making the slope roughly 4.136 × 10⁻¹⁵ V·s. In 1916, American physicist Robert A. Millikan proved this constant slope experimentally in his landmark paper A Direct Photoelectric Determination of Planck's "h", using it to calculate Planck's constant to remarkable precision. No matter what material you use in the experiment, the steepness of this line will never change.
What do the intercepts of the V₀-ν graph tell you?
The points where the straight line crosses the axes hold specific physical meaning for the metal you are testing in the laboratory.
The y-intercept is −Φ/e: This is the exact point where the line meets the vertical axis (when ν = 0). Because the work function Φ changes from metal to metal, the y-intercept is unique to the material being illuminated. If you multiply the magnitude of this intercept by e, you get the work function in electron-volts (eV).
The x-intercept is the threshold frequency (ν₀): This is the point on the horizontal axis where V₀ = 0. It represents the minimum frequency of light needed to eject an electron from the surface. Below this threshold frequency, the incoming photons simply do not have enough energy to overcome the work function, meaning no photoelectric emission occurs at all, regardless of how bright the light is.
Are the V₀-ν lines for different metals parallel?
Yes, the graphs of stopping potential versus frequency for different metals are always completely parallel to each other. Because the slope is firmly fixed at h/e regardless of the material, changing the metal only changes the work function (Φ).
On a plotted graph, a different work function shifts the line left or right (which changes the x-intercept ν₀) and up or down (which changes the y-intercept −Φ/e). For example, a reactive metal like potassium has a low work function, so its line crosses the axes closer to the origin. A metal like zinc has a much higher work function, so its line is shifted further to the right. However, the steepness remains exactly the same.
When revising these topics, if you find yourself struggling with how work functions shift these lines, the Fermi Concept Library holds every concept in physics, each with its own lesson and its place in the map.
How to read a stopping potential graph in an exam?
Exam questions in JEE Main, NEET, and board exams often ask you to extract physical values directly from a given V₀-ν graph. Use this three-step framework to avoid common mistakes:
Check the axes: First, ensure the y-axis is stopping potential V₀ (measured in volts) and the x-axis is frequency ν (often given in units of 10¹⁴ Hz). If the y-axis happens to be maximum kinetic energy (K_max) instead of V₀, the slope of the line will be h, not h/e.
Find the work function: Trace the straight line backward until it hits the y-axis. Read the negative voltage value, drop the minus sign, and that number is your work function in electron-volts (eV). For instance, a y-intercept of −2.5 V means the work function is exactly 2.5 eV.
Calculate Planck's constant: Pick two clear, well-separated points on the line. Find the change in the stopping potential (ΔV₀) and divide it by the change in the frequency (Δν). Multiply this calculated slope by the known charge of an electron (e) to find h.


