On this page
You don't need to memorise the four-row table of signs for ΔH, ΔS and ΔG. Draw one graph of ΔG against temperature and all four rows fall out of it, including the temperature at which a reaction switches from non-spontaneous to spontaneous.
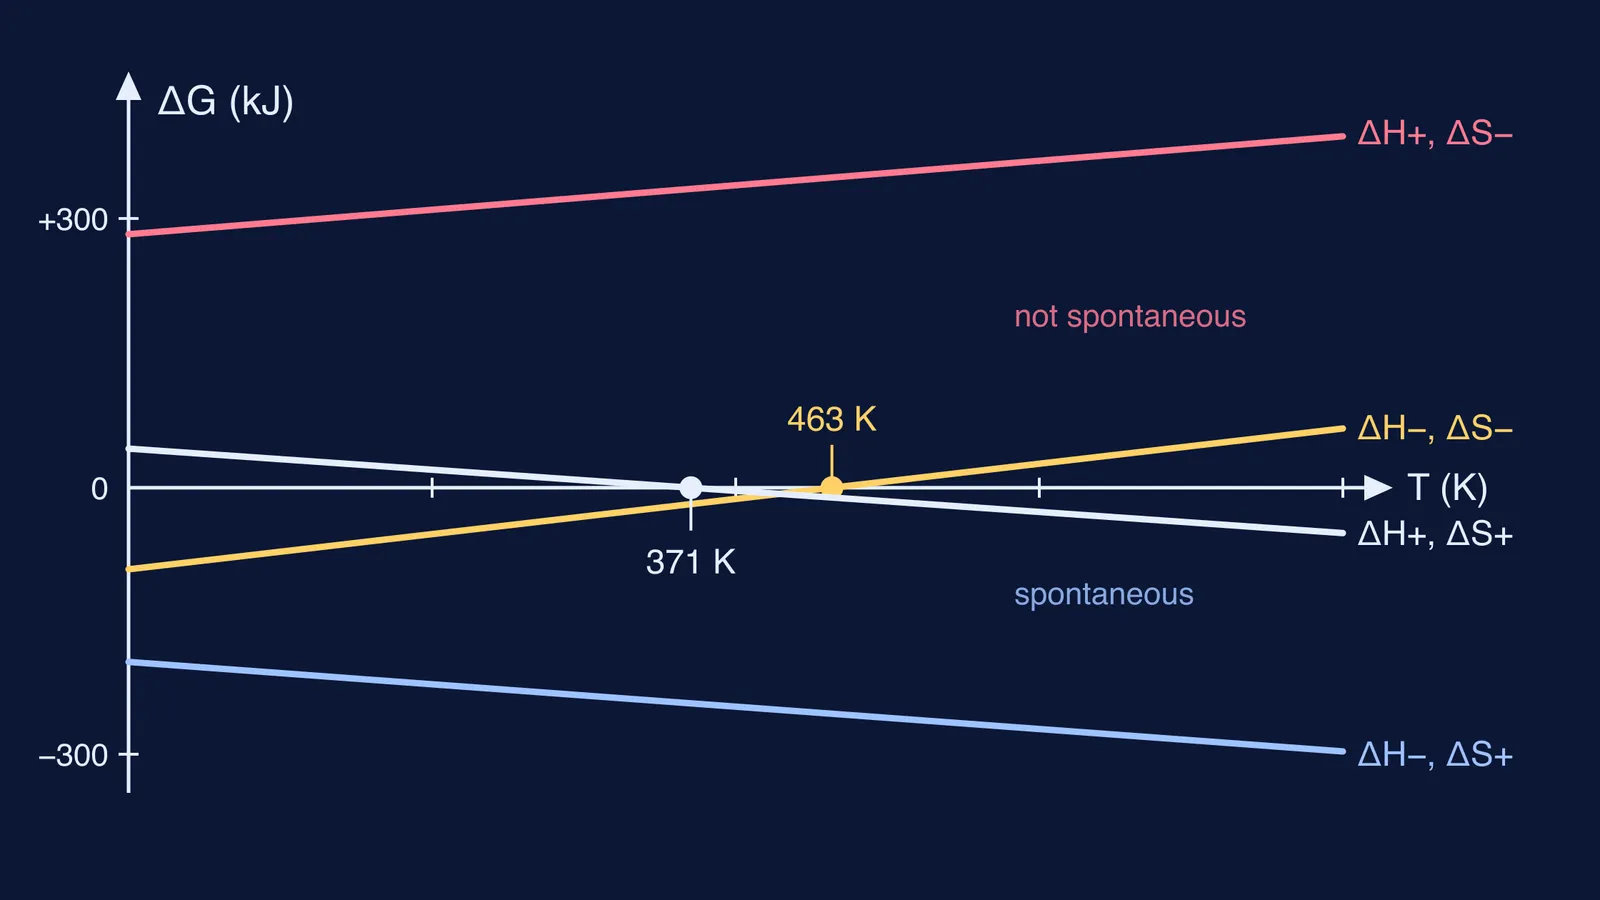
The rule you start from: a process is spontaneous when ΔG < 0 and non-spontaneous when ΔG > 0, as stated in OpenStax Chemistry 2e, section 16.4. On the graph, that means "below the T axis" is spontaneous and "above it" is not.
Why is the graph of ΔG against temperature a straight line?
At constant temperature and pressure, ΔG = ΔH − TΔS (LibreTexts, Free Energy and Temperature/19:_Chemical_Thermodynamics/19.06:_Free_Energy_and_Temperature)). The same page notes that, in the absence of a phase change, neither ΔH nor ΔS varies greatly with temperature, so we can treat both as constants.
Compare that with y = c + mx. Temperature T is your x, ΔG is your y, the intercept c is ΔH and the slope m is −ΔS. Two consequences follow at once:
The sign of ΔH tells you where the line starts at T = 0: above the axis if ΔH is positive, below if negative.
The sign of ΔS tells you which way it tilts: a positive ΔS makes the slope negative, so the line falls as T rises; a negative ΔS makes it rise.
Set ΔG = 0 and you get the crossover: T = ΔH/ΔS.
What do the four sign cases look like on the graph?
Here is one real reaction per case. Values are per mole of reaction as written, calculated from the standard enthalpies of formation and entropies in OpenStax Chemistry 2e, Appendix G, except water, which is OpenStax's own worked example.
ΔH negative, ΔS positive. 2H₂O₂(l) → 2H₂O(l) + O₂(g): ΔH° = −196.1 kJ, ΔS° = +126.0 J/K. The line starts below the axis and slopes further down. It never crosses, so the reaction is spontaneous at all temperatures.
ΔH positive, ΔS negative. 3O₂(g) → 2O₃(g): ΔH° = +285.4 kJ, ΔS° = −137.8 J/K. The line starts above the axis and climbs. It never crosses, so the reaction is never spontaneous.
Both negative. N₂(g) + 3H₂(g) → 2NH₃(g): ΔH° = −91.8 kJ, ΔS° = −198.1 J/K. It starts below the axis, rises and crosses at about 463 K. Spontaneous below that, not above.
Both positive. H₂O(l) → H₂O(g): ΔH° = +44.01 kJ, ΔS° = +118.8 J/K. It starts above the axis, falls and crosses at 370.5 K. OpenStax compares this estimate with water's actual boiling point of 373.2 K (section 16.4).
How do you find the temperature when a reaction becomes spontaneous?
Here is the ammonia case worked from the Appendix G table, step by step.
Enthalpy: ΔH° = 2 × ΔHf°(NH₃) = 2 × (−45.9) = −91.8 kJ, since elements have ΔHf° = 0.
Entropy: ΔS° = 2(192.8) − 191.6 − 3(130.7) = −198.1 J/K.
Units: convert ΔH to joules, −91,800 J, so it matches ΔS in J/K.
Crossover: T = ΔH/ΔS = (−91,800)/(−198.1) ≈ 463 K, the same answer LibreTexts/19:_Chemical_Thermodynamics/19.06:_Free_Energy_and_Temperature) reaches.
Side: ΔS is negative, so the slope −ΔS is positive and the line rises. It is below the axis before 463 K, so the reaction is spontaneous below about 463 K (roughly 190 °C).
To sketch it by hand, plot two points. At T = 0, ΔG = −91.8 kJ. At 800 K, ΔG = −91.8 + 0.8 × 198.1 ≈ +66.7 kJ. Join them and the crossing sits just past halfway, where the calculation put it.
How can you check an AI's crossover temperature answer?
Before you trust a crossover temperature, from an AI or your own notes, run the sketch test against ΔG = ΔH − TΔS (LibreTexts/19:_Chemical_Thermodynamics/19.06:_Free_Energy_and_Temperature)):
Units. If the ammonia answer comes out as 0.463 K, kilojoules were divided by J/K without the factor of 1000.
Signs. If ΔH and ΔS differ in sign, any crossover temperature is wrong. The correct answer is "always" or "never".
Direction. Positive ΔS means spontaneous above the crossover; negative ΔS means below. An answer that says "above" for ammonia has the slope backwards.
Assumption. The straight line assumes no phase change in the range. If one happens, ΔH and ΔS change and the line bends.
Ideas like this are easier to see than to read, which is what the Fermi Simulation Lab is built around. If you are stuck on why the line tilts the way it does, Fermi's AI tutor can draw the figure and check your understanding as it goes.
For more practice, see the temperature at which a reaction becomes spontaneous, T = ΔH/ΔS, then read the ΔG against temperature graph's slope, intercept and crossover and Gibbs energy and spontaneity, worked out.