
On this page
Push the plunger of a sealed syringe and it pushes back. That is Boyle's law, and you can test it twice: in a simulation and on your desk with a syringe, a clamp stand and some masses.
What does Boyle's law say about a syringe?
Boyle's law: the volume of a given amount of gas held at constant temperature is inversely proportional to the pressure on it (OpenStax Chemistry 2e). In symbols, PV = constant, so halving the volume doubles the pressure. OpenStax illustrates it with an airtight syringe: push the plunger and the gas takes a smaller volume at a higher pressure; pull it and the reverse happens.
Both conditions matter: no leaks, and no change in temperature (no fast squeezing, no warm hands on the barrel).
What we call Boyle's law was first published in 1662, in an appendix to the second edition of Boyle's New Experiments, with a small table of numbers showing an inverse relationship between the pressure and volume of air (Science History Institute). If your lab uses a trapped column of air instead of a syringe, our guide to the Boyle's law experiment with an air column covers that version.
Why plot P against 1/V instead of P against V?
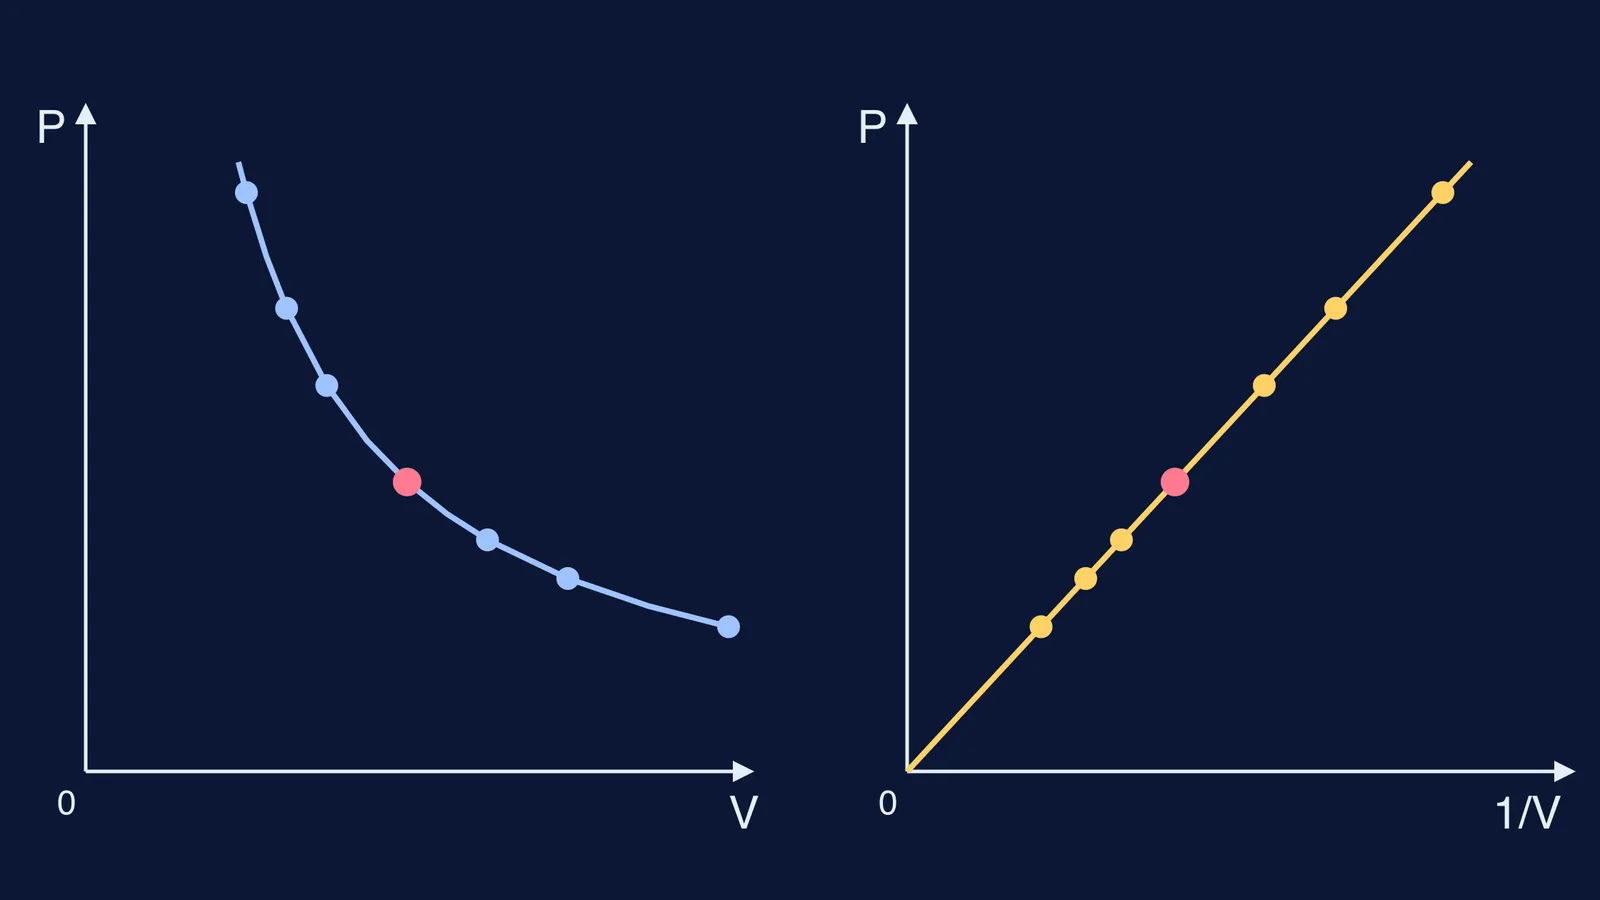
A P against V graph for Boyle's law is a hyperbola (OpenStax Chemistry 2e). By eye, one curve looks much like another. Plot P against 1/V instead and, if the law holds, the points fall on a straight line through the origin, with a slope equal to the constant PV.
How do you try Boyle's law in a simulation?
Use any gas simulation with a movable wall or piston and a way to hold the temperature fixed.
Fix the temperature and the amount of gas.
Move the piston to a new volume, wait for the pressure reading to settle, and write down V and P.
Take readings across the widest range the simulation allows.
Add a third column, 1/V, and plot P against 1/V.
If the simulation lets you, release the temperature lock and compress quickly. The points leave the line because the gas warms as you compress it.
Our post on adiabatic vs isothermal compression in a simulation takes that comparison further.
The Fermi Simulation Lab collects interactive simulations for ideas that are easier to see than read. Fermi's AI tutor can run a simulation with you and check your understanding as it goes, so you can ask why the line bends when it does.
How do you test Boyle's law with a real sealed syringe?
The exam board AQA's set-up guide for its A-level Boyle's law practical uses a plastic syringe with its nozzle closed, clamped upside down, with masses hung from the plunger (AQA practical set-up guide). The guide draws in 4.0 ml of air, measures the rubber seal with callipers (20.27 mm across in its photo), and adds masses up to a total of 1000 g, reading the volume on the syringe scale each time.
The hanging masses pull the plunger outwards, so the gas pressure falls below the air pressure outside:
P = P(atm) − mg/A, where A is the area of the rubber seal.
One standard atmosphere is defined as exactly 101 325 Pa (BIPM, 10th CGPM, Resolution 4). Use a local barometer reading if you have one.
A worked example: take the seal diameter from the AQA guide, 20.27 mm. The area is A = π × (0.010135 m)² = 3.23 × 10⁻⁴ m². Each 100 g hung adds a force of 0.981 N, so it lowers the gas pressure by 0.981 ÷ (3.23 × 10⁻⁴) ≈ 3.04 kPa. Starting from 4.00 ml at 101.3 kPa, and ignoring the plunger's own weight and friction, Boyle's law predicts:
0 g: P = 101.3 kPa, V = 4.00 ml
400 g: P = 89.1 kPa, V = 4.55 ml
800 g: P = 77.0 kPa, V = 5.26 ml
1000 g: P = 70.9 kPa, V = 5.72 ml
Write your measured volumes next to these before you plot anything; the gaps show what your apparatus is doing.
What does your graph tell you when it is not perfect?
Close to straight but missing the origin: the nozzle holds air that the scale does not show. Plot the scale volume against 1/P instead; the line then crosses the volume axis at minus that hidden volume.
Volume creeps after each mass: the gas inside is below outside pressure, so air is leaking in. Re-seat the cap and start again.
Volumes smaller than predicted, in jerky steps: the plunger is sticking. Twist it gently before each reading.
Points curve away when you work quickly: the temperature changed. Wait a little before each reading.
The same law explains why chips packets puff up in the hills: lower pressure outside, bigger volume inside. Try the simulation first, then see how close your desk gets to the line.