

On this page
Picture a gas in a cylinder with a piston. In one run you push the piston in slowly, with the cylinder sitting in a big bath of water at room temperature. In the next run you slam it in so fast that no heat has time to move. Both runs halve the volume. Before you press play in a simulation, write down three predictions: which curve on the pressure-volume (PV) graph is steeper, what the thermometer does, and where the work shows up on the graph.
What is the difference between an isothermal and an adiabatic process?
An isothermal process keeps the gas at constant temperature by keeping it "in thermal equilibrium with a heat reservoir at that temperature", as OpenStax University Physics, section 3.2 puts it. That is your slow push in the water bath.
An adiabatic process is one with no heat exchange, Q = 0, and for an ideal gas it follows pV^γ = constant, where γ = Cp/Cv (OpenStax, section 3.6). Real fast compressions come close: OpenStax notes that in a car cylinder the compression happens "so quickly that there is no time for the mixture to exchange heat with its environment".
For a diatomic ideal gas such as air, Cp = 7/2 R and Cv = 5/2 R, so γ = 1.40 (OpenStax, section 3.5).
Which PV curve is steeper, adiabatic or isothermal?
The adiabatic curve is steeper. Differentiate both equations at the same point: an isotherm has slope dp/dV = −p/V, and an adiabat has slope dp/dV = −γp/V (OpenStax, section 3.6). Since γ is greater than 1, OpenStax concludes that "the isothermal curve is not as steep as that for the adiabatic expansion". The same holds for compression, since it is the same curve run backwards.
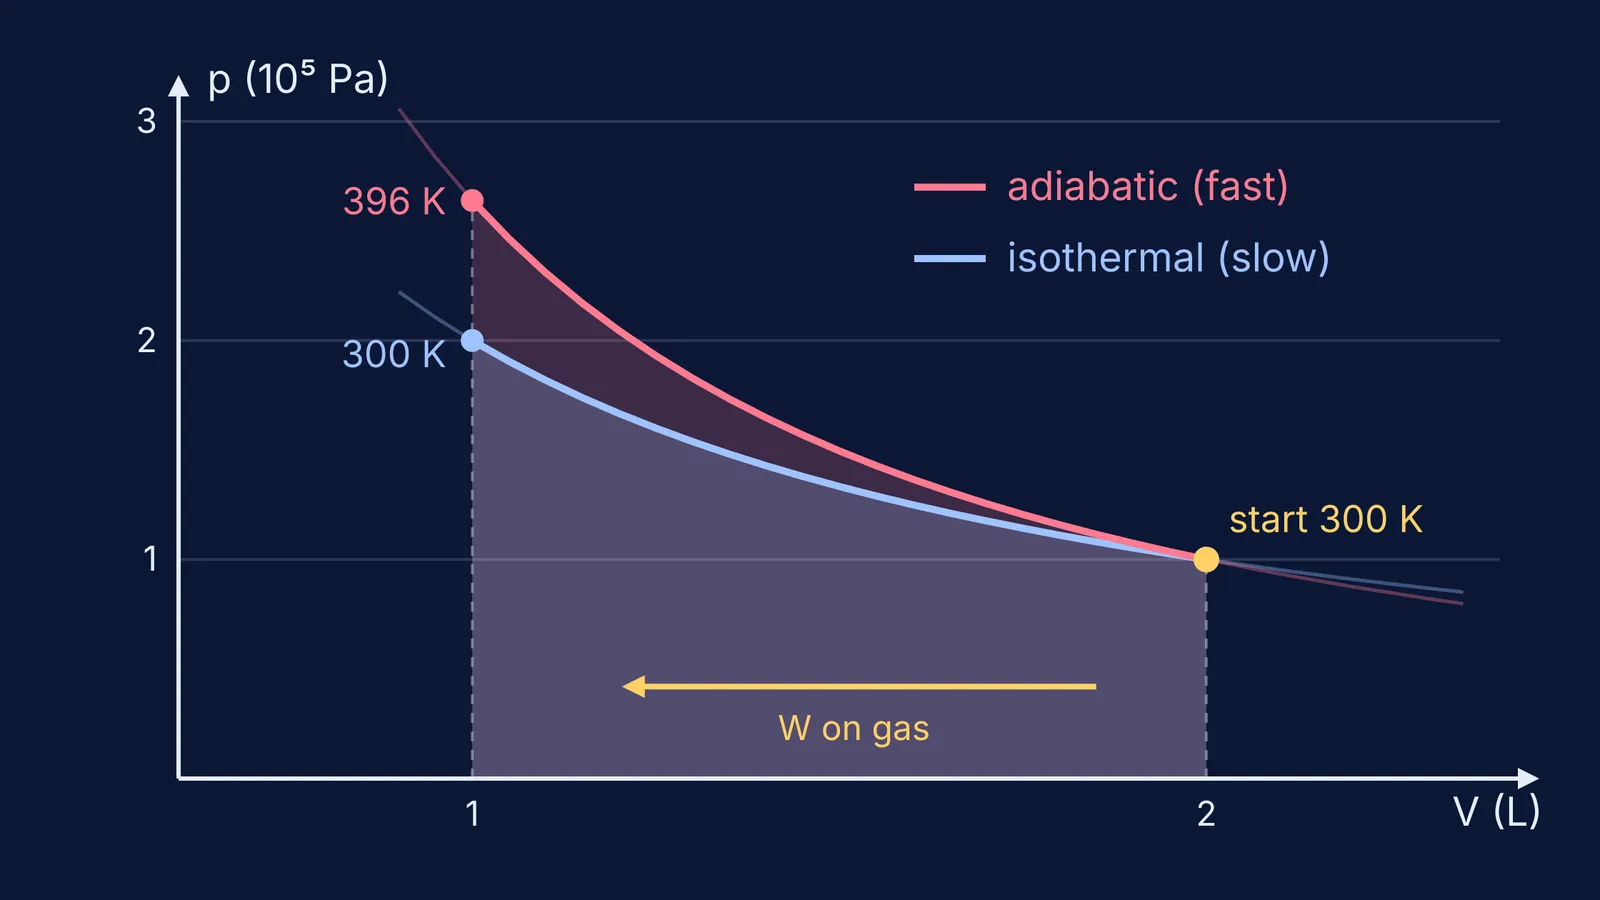
For air, that makes the adiabat 1.4 times steeper wherever the two curves cross. In the hero graph both runs start at the same yellow point, and the red fast curve climbs higher by the time the volume is halved.
What happens to the temperature in each case?
In the slow run the temperature stays put, by definition. You still do work on the gas, but the same amount of energy leaves as heat into the bath, so internal energy does not change.
In the fast run there is nowhere for that energy to go. OpenStax states that when an ideal gas "is compressed adiabatically (Q=0), work is done on it and its temperature increases" (section 3.6). That extra temperature is also why the adiabat ends higher: by pV = nRT, a hotter gas at the same volume pushes back harder.
Where does the work done show on a PV diagram?
Work is the area under the curve, between the curve and the volume axis. OpenStax describes the work integral as "the area under the pV curve" and stresses that work depends on the path taken (section 3.2). Going from right to left (compression) means work is done on the gas.
Because the adiabat sits above the isotherm across the whole compression, the area under it is bigger. A fast squeeze to the same final volume takes more work. If you join paths into a closed loop, the enclosed area is the net work, which we cover in our guide to reading work from the area of a cyclic process loop.
A worked example to check against your simulation
Take air (γ = 1.40) at 1.0 × 10^5 Pa, 2.0 L and 300 K, and halve its volume to 1.0 L. These are the numbers behind the hero graph, from the isothermal work formula in OpenStax section 3.2 and the adiabatic formulas in section 3.6.
Isothermal: p2 = p1V1/V2 = 2.0 × 10^5 Pa. Temperature stays 300 K. Work on the gas = p1V1 ln(V1/V2) = 200 J × 0.693, about 139 J, and about 139 J of heat leaves.
Adiabatic: p2 = p1(V1/V2)^1.4 = 2^1.4 × 10^5 Pa, about 2.64 × 10^5 Pa. Temperature T2 = T1(V1/V2)^0.4 = 300 K × 1.32, about 396 K (roughly 123 °C).
Adiabatic work on the gas = (p2V2 − p1V1)/(γ − 1) = (264 J − 200 J)/0.4, about 160 J. All of it becomes internal energy, since Q = 0.
Check: 160 J is more than 139 J, matching the larger red area.
Now run it. The Fermi Simulation Lab has interactive simulations for ideas that are easier to see than to read. Use any gas simulation that lets you fix the temperature or insulate the walls, and follow this plan:
Write your three predictions before touching anything.
Do the slow, constant-temperature run first and record pressure at half volume.
Repeat with the walls insulated or the push fast, and record pressure and temperature.
Compare with the numbers above, then explain any gap in one sentence.
Predict-then-check is the habit behind our piece on why simulations beat static diagrams for some ideas. For more on the formulas, see our guide to isothermal and adiabatic processes.
If your numbers don't match, the Fermi Problem Library has a step-by-step solver that explains the reasoning, so you can find the step where your working went wrong.


