
On this page
There is a good chance the electricity behind your ceiling fan came from steam. The US Energy Information Administration says steam turbines generate most of the world's electricity. Coal and nuclear plants use them, as do biomass plants, solar thermal plants and most geothermal plants. The loop of water and steam inside them is named after a Glasgow engineer, William Rankine.
Who was William Rankine?
William John Macquorn Rankine was born in Edinburgh on 5 July 1820 and died in Glasgow on 24 December 1872, according to his Dictionary of Scientific Biography entry on Encyclopedia.com. From 1855 he was regius professor of civil engineering and mechanics at the University of Glasgow. His A Manual of the Steam Engine and Other Prime Movers appeared in 1859 and went through many editions.
He predicted that saturated steam has a negative apparent specific heat, which experiments later confirmed. His analysis of ideal engines that use a condensable vapour, such as steam, is what we now call the Rankine cycle.
The Rankine scale, an absolute temperature scale with Fahrenheit-sized degrees, carries his name; NIST's conversion guide gives T/K = (T/°R)/1.8.
What are the four steps of the Rankine cycle?
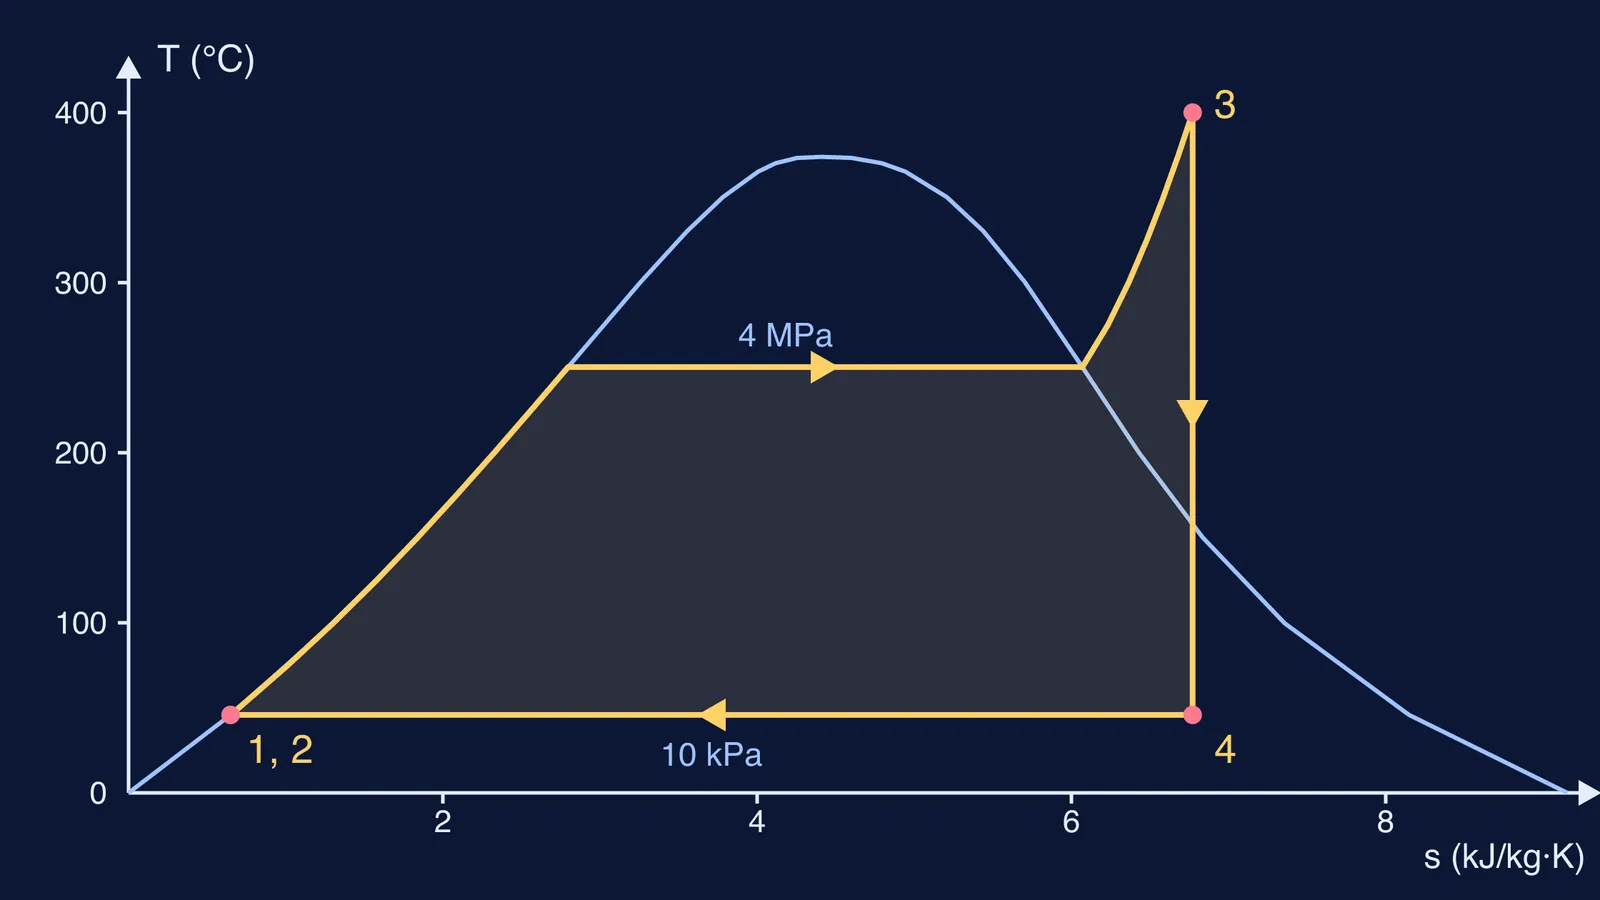
The ideal Rankine cycle takes water round a closed loop:
Pump (1 to 2): liquid water is pumped up to boiler pressure, which takes little work.
Boiler (2 to 3): the water is heated at constant pressure until it boils, and is often superheated beyond that.
Turbine (3 to 4): the high-pressure steam expands through a turbine, which turns the generator.
Condenser (4 to 1): the wet steam gives its heat to cooling water at constant pressure and turns back into liquid.
Step 4 is the clever part. Because the steam becomes water again, the pump pushes a liquid, not a gas. Compare the gas-only engine in our post on how Robert Stirling's hot-air engine works.
How efficient is a Rankine cycle?
Take a small plant: steam leaves the boiler at 4 MPa and 400 °C, and the condenser runs at 10 kPa. Every property below comes from the NIST Chemistry WebBook fluid data for water, with enthalpy h in kJ/kg and entropy s in kJ/kg·K.
State 1, saturated liquid at 10 kPa: 45.8 °C, h1 = 191.8, specific volume v = 0.00101 m³/kg, s1 = 0.649.
Pump work = v × ΔP = 0.00101 × (4000 − 10) kPa = 4.0 kJ/kg, so h2 = 195.8.
State 3, steam at 4 MPa and 400 °C: h3 = 3214.5, s3 = 6.771.
State 4, after an ideal turbine, has s4 = s3. Saturated vapour at 10 kPa has s = 8.149 and h = 2583.9, so the dryness fraction is x = (6.771 − 0.649)/(8.149 − 0.649) = 0.816, and h4 = 191.8 + 0.816 × 2392.1 = 2144.5.
Turbine work = 3214.5 − 2144.5 = 1070.0. Net work = 1070.0 − 4.0 = 1066.0. Heat added in the boiler = 3214.5 − 195.8 = 3018.7.
Efficiency = 1066.0/3018.7 = 35.3%.
The pump's 4.0 kJ/kg is under 0.4% of the turbine's 1070.0 kJ/kg. And the steam leaving the turbine is only about 82% vapour; the rest is droplets.
Why is the Rankine cycle less efficient than a Carnot engine?
With the NIST temperatures above, a Carnot engine between 400 °C (673.15 K) and 45.8 °C (318.96 K) would reach 1 − 318.96/673.15 = 52.6%. The temperatures must be in kelvin, a slip we cover in Carnot efficiency: why the temperatures must be in kelvin.
The gap comes from the boiler. At 4 MPa water boils at about 250 °C, and only the superheating at the end reaches 400 °C; much of the heat warms water that left the pump at 46 °C. Divide the heat added by the entropy it adds, 3018.7/(6.771 − 0.649), and the average temperature of heat addition is about 493 K (220 °C). Put that into the Carnot formula: 1 − 318.96/493 = 35.3%, the same answer as before. To improve a steam plant, raise that average or lower the condenser temperature.
How should you solve a Rankine cycle problem?
Sketch the T-s diagram and number the four states.
Use s4 = s3 for the ideal turbine and v × ΔP for the pump.
Find the dryness fraction at the turbine exit before h4.
Net work = turbine work − pump work; efficiency = net work/(h3 − h2).
For the energy bookkeeping behind step 4, see our post on work from a heat engine, W = Q1 − Q2.
If the T-s diagram is the hard part, the Fermi Simulation Lab has interactive simulations for ideas that are easier to see than to read. If your numbers keep coming out wrong, the Fermi Problem Library has worked problems with a step-by-step solver that explains the reasoning rather than printing an answer.