
On this page
Most earthquakes you hear about start a few kilometres down. In the 1920s many scientists doubted that any started much deeper. Kiyoo Wadati, a Japanese seismologist, showed they were wrong. Then he noticed that under Japan the deep earthquakes sit on a tilted surface, which later became key evidence for plate tectonics.
Who was Kiyoo Wadati?
Wadati was born in Nagoya on 8 September 1902, graduated in physics from the Imperial University of Tokyo in 1925 and died in Tokyo on 5 January 1995, according to the Complete Dictionary of Scientific Biography entry on Wadati. He worked at the Central Meteorological Observatory and became Director-General of the Japan Meteorological Agency in 1956.
He had good tools. Seismologist Cliff Frohlich, in a 1987 review in the Journal of Geophysical Research, writes that the Japan Meteorological Agency then ran the world's best regional network of seismic stations. The same review notes that other scientists had argued "normal" earthquake depths were less than about 35 km.
How did Wadati prove some earthquakes are deep?
Wadati published the key paper in 1928, in the first volume of the Geophysical Magazine, as Frohlich's review describes. He used three kinds of evidence:
Timing. An earthquake sends out fast P waves and slower S waves. The gap between them, the S−P time, grows with distance from the source. For a shallow 1925 earthquake, the shortest S−P time at any station was under 10 seconds. For a 1927 earthquake with almost the same epicentre, it was more than 40 seconds.
Shaking pattern. Shallow earthquakes shook hard near the epicentre and faded quickly with distance. The deep ones produced patches of fairly strong shaking separated by areas where they were not felt.
The wave records themselves. Deep events had sharper, larger S waves and less trailing "coda".
In a 1929 paper he sorted earthquakes into shallow (within about 60 km), intermediate (about 100 to 200 km) and deep (over 300 km), a scheme Frohlich calls essentially still in use.
How can you estimate depth from the S−P time?
Here is Wadati's timing argument as a worked example you can do on paper.
A classroom rule of thumb from the Saint Louis University earthquake location exercise says: multiply the S−P time in seconds by 8 to get the distance to the earthquake in kilometres.
Find the station with the shortest S−P time. If it sits close to the point above the source, its distance to the source is roughly the depth.
For the 1925 earthquake: under 10 s × 8 = under 80 km. A shallow event.
For the 1927 earthquake: over 40 s × 8 = over 320 km. That is far below the crust.
Wadati also used ratios: if two stations record S−P times of 10 s and 20 s, the second is twice as far from the source. Three such pairs pin the source to a point.
What did Wadati's 1935 map show?
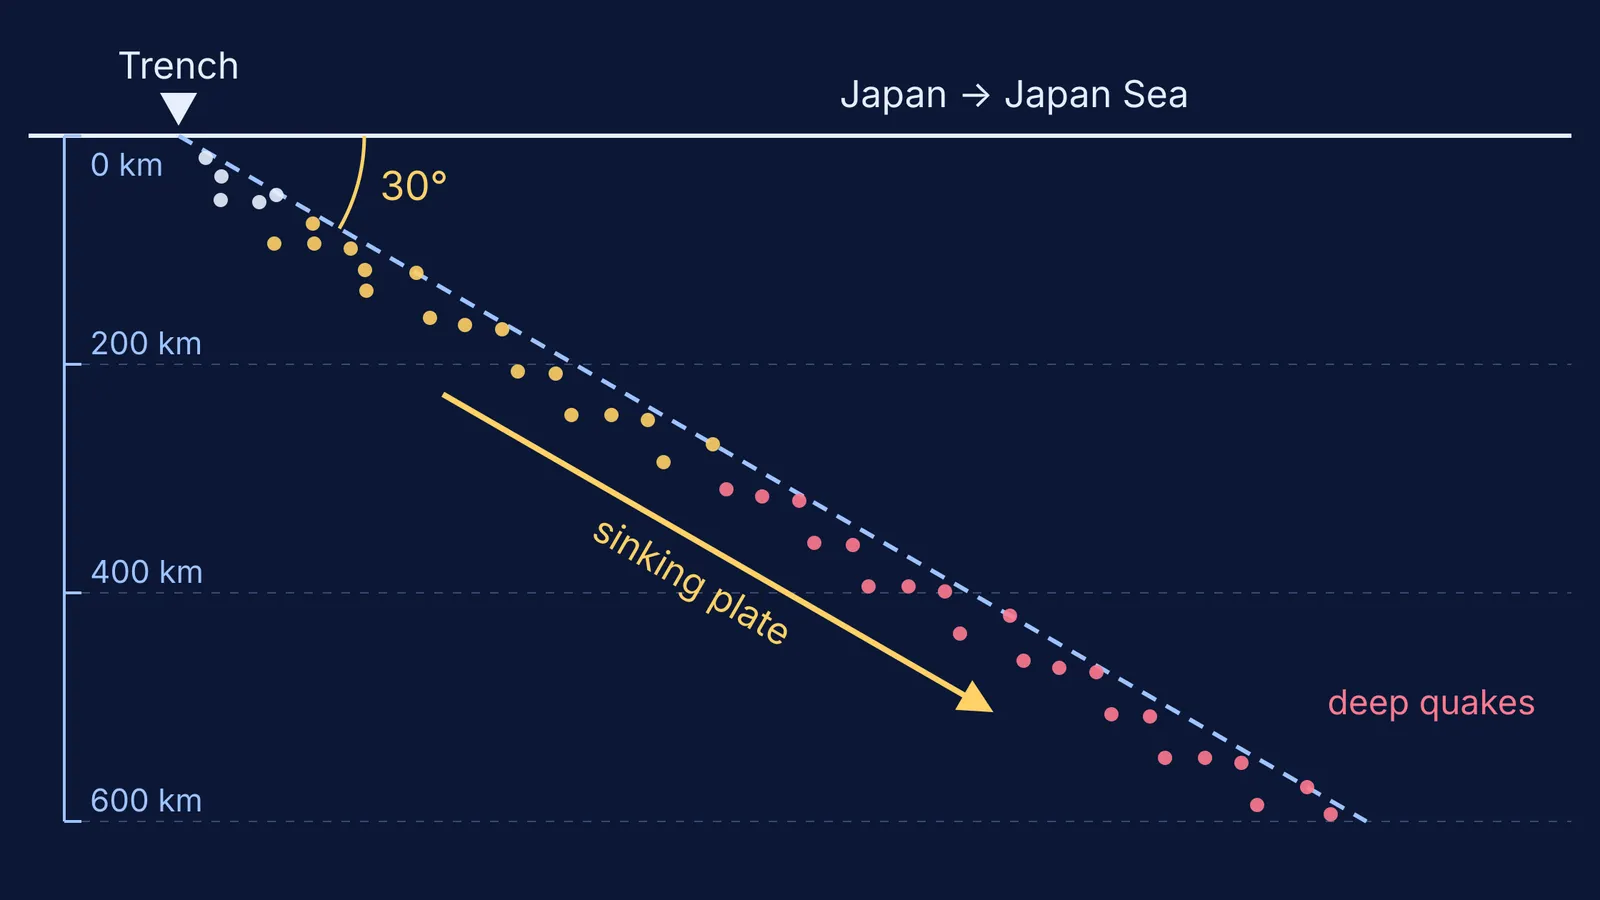
By 1935 Wadati had enough deep earthquakes to draw lines of equal focal depth across Japan. Frohlich calls this the first contour map ever published of the inclined zone. Shallow earthquakes lie on the Pacific side. Moving inland towards the Japan Sea and Asia, the earthquakes get steadily deeper.
Wadati described it himself in that 1935 paper, quoted by Frohlich: the contour lines suggest "something like a weak surface at where the earthquake outburst is liable to occur. This surface extends slopewise in the crust near the Japanese Islands." He linked the zone to Japan's volcanoes and even wondered whether Alfred Wegener's continental drift might show up in such maps.
Why is it called the Wadati–Benioff zone?
In 1949 and 1954, the American seismologist Hugo Benioff described similar dipping zones under the Tonga–Kermadec islands and South America, according to Frohlich's review. Both names now go on the zone.
The explanation came with plate tectonics. In 1968, Bryan Isacks, Jack Oliver and Lynn Sykes published Seismology and the new global tectonics, linking earthquake patterns to moving plates. By 1987, Frohlich wrote, nearly all scientists believed that subduction and its deep earthquakes form the cold, sinking limbs of convection cells in the mantle.
Modern data sharpen the picture. A 2020 study in Scientific Reports describes the earthquakes below 300 km under the Japan Sea as a narrow, almost planar zone less than 50 km thick, dipping at about 30° to about 600 km depth. The authors argue they map the top and bottom of the sinking Pacific plate.
Read next: how Akitsune Imamura warned of the 1923 Kanto earthquake, why Delhi lies in a high earthquake risk zone and why tsunami waves grow taller near the coast.
A sloping plate is hard to picture from a flat textbook figure. If that is where you get stuck, the Fermi Simulation Lab has interactive simulations for ideas that are easier to see than to read. You can also look up P and S waves in the Fermi Concept Library, where each concept has its own lesson.