On this page
If you drive from Delhi to Kolkata, much of the highway you use was upgraded in the 2000s under one national project. Economists later used that upgrade to test a question governments argue about: do big roads change what happens around them?
What is the Golden Quadrilateral?
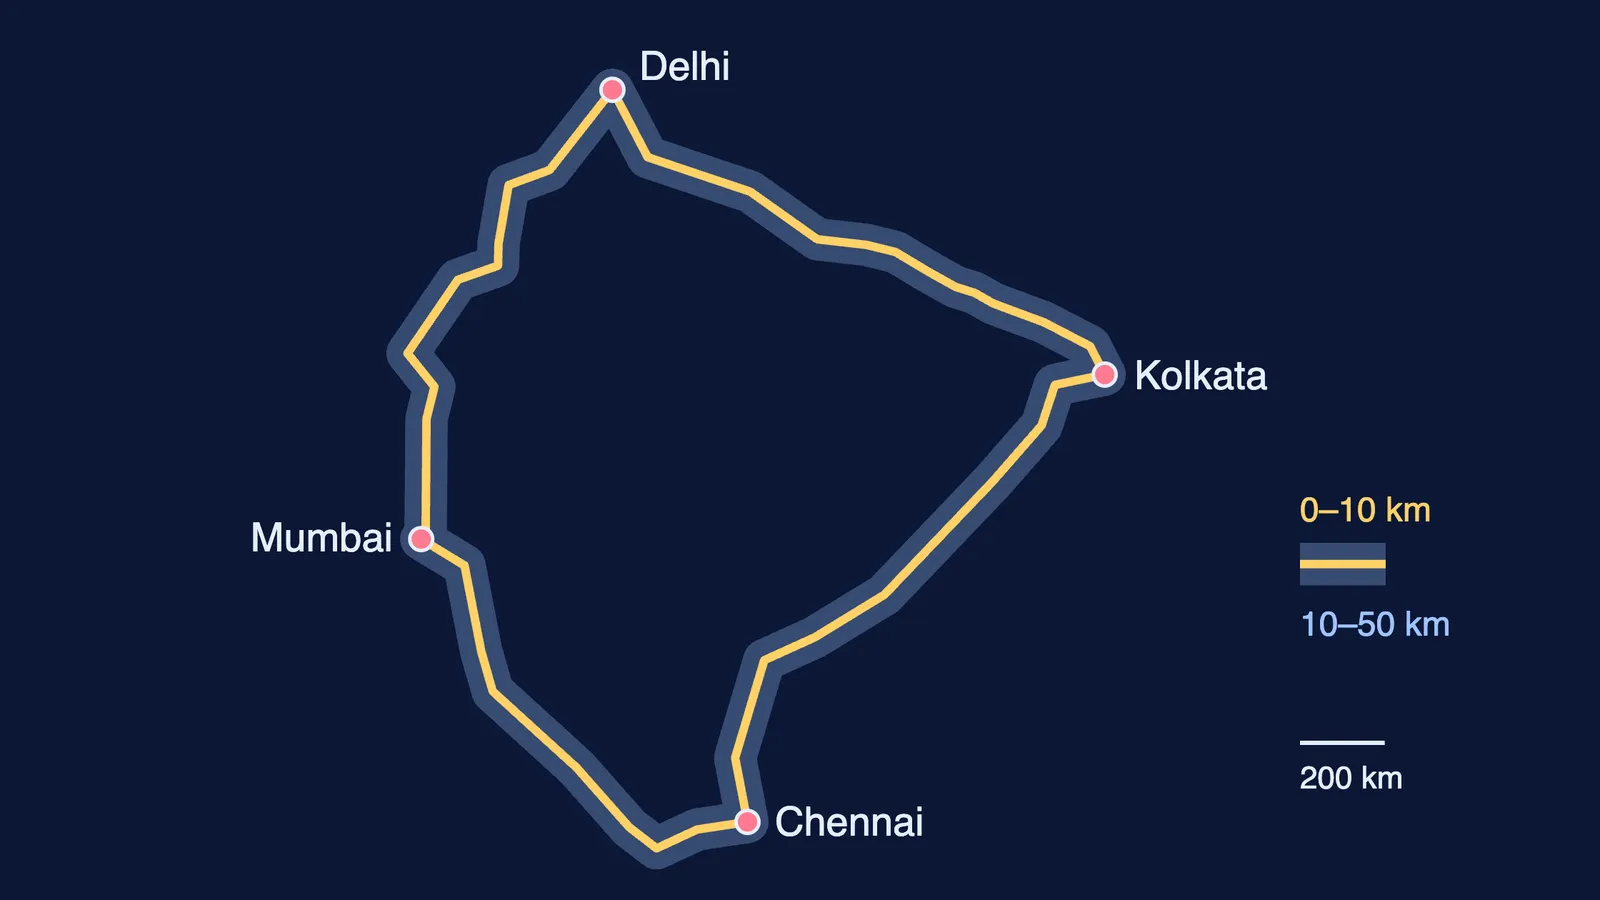
The Golden Quadrilateral (GQ) is a 5,846 km highway network connecting Delhi, Mumbai, Chennai and Kolkata, according to a study by Ejaz Ghani, Arti Grover Goswami and William Kerr. The same paper records that the project began in 2001, was two-thirds complete by 2005 and was mostly finished in 2007. It improved the quality and width of existing highways, and in places built new road where none existed.
The four sides run Delhi to Mumbai through Jaipur and Ahmedabad, Mumbai to Chennai through Pune and Bengaluru, Chennai to Kolkata along the east coast through Vijayawada and Bhubaneswar, and Kolkata back to Delhi through Varanasi, Kanpur and Agra (list of major towns on each segment).
What did economists measure after the highways were built?
Ghani, Goswami and Kerr used plant-level data on Indian organised manufacturing from 1994, 2000, 2005 and 2007 (NBER working paper). They did not read changes in the four hub cities as effects of the road, because the project was designed around those hubs. Instead they compared districts 0–10 km from the GQ with districts 10–50 km away.
What they found:
Districts within 10 km saw higher entry rates (more new factories) and higher plant productivity; districts 10–50 km away did not. The authors caution that part of the productivity gain may be a rebound from a dip in 2000.
The effect on the total level of manufacturing was positive but not statistically significant in data ending in 2007, which the authors note may be too soon after construction.
New entry near the road was strongest in industries that use a lot of land and buildings, which sorted away from the hub districts.
The upgrades helped spread activity to moderate-density districts and intermediate cities.
The clever part is the comparison road. India's North-South East-West corridor was meant to be upgraded at the same time, but the work was delayed, and the same effects did not appear along it. The published version in The Economic Journal adds that both new and existing firms drove output growth, and that the upgrades improved the allocative efficiency of industries initially on the network.
Why did factories near the highway change how they worked?
A second study looked inside firms. Saugato Datta, using World Bank Enterprise Surveys from 2002 and 2005, found that firms in cities on the upgraded GQ routes reduced their average stock of input inventories by between 6 and 12 days' worth of production (abstract on RePEc). Firms in cities where roads did not improve showed no significant change, and GQ firms were more likely to have switched their main input supplier.
The logic: if trucks arrive reliably, a factory need not keep weeks of raw material in a godown just in case.
How are highway curves designed?
On a curve of radius R at speed v, a vehicle needs a sideways (centripetal) acceleration of v²/R. Engineers supply it two ways: by raising the outer edge of the road (superelevation, e) and through tyre friction (f). The Indian Roads Congress design steps set out in an NPTEL transportation engineering lecture rest on e + f = v²/(gR) (NPTEL lecture on superelevation design).
The Indian Roads Congress caps superelevation at 7 percent for plain and rolling terrain, 10 percent for hilly terrain and 4 percent for urban roads (NPTEL lecture on maximum superelevation). The design method takes e = 0.07 and a friction coefficient of 0.15, so the highest speed a curve allows is v = √(0.22gR). For the force diagram behind this, see our post on the maximum safe speed on a banked road.
Worked example: a 300 m curve
Take a curve of radius 300 m and g = 9.81 m/s².
Allowed speed: v = √(0.22 × 9.81 × 300) = √647 ≈ 25.4 m/s, about 92 km/h.
At 100 km/h (27.8 m/s), v²/(gR) = 771.6 ÷ 2,943 ≈ 0.26. With e = 0.07, the tyres must supply f ≈ 0.19, more than 0.15. Not safe.
At 80 km/h (22.2 m/s), v²/(gR) ≈ 0.17, so f ≈ 0.10. Safe.
To carry 100 km/h, the radius must be at least 771.6 ÷ (0.22 × 9.81) ≈ 358 m.
So the engineer either flattens the bend or posts a lower speed limit. Notice that safe speed grows only with the square root of the radius: doubling R raises it by about 41 percent, not 100.
If the forces are hard to picture, the Fermi Simulation Lab has interactive simulations for ideas that are easier to see than to read, and the Fermi Problem Library has worked problems with a step-by-step solver that explains the reasoning.
What can you do with this?
When you read "this project boosted growth", look for the comparison group and the time window.
Pick a flyover ramp near you, estimate its radius, and work out its safe speed with e = 0.07 and f = 0.15.
Read about how John McAdam rethought the road surface and careers in roads, metro and traffic engineering.