On this page
Friedrich Paschen was a German experimental physicist, born in Schwerin in 1865, who became professor of physics at the University of Tübingen in 1901 (biography of Friedrich Paschen). When your textbook says “Paschen series”, he is the person it is named after.
Who discovered the Paschen series?
Friedrich Paschen discovered it in 1908, in a paper in Annalen der Physik titled “Zur Kenntnis ultraroter Linienspektra. I.”, meaning “On infrared line spectra, part I”, volume 332, pages 537 to 570 (Crossref record of Paschen's 1908 paper). Its full title says it gives standard wavelengths in the infrared up to 27,000 ångström (2,700 nm).
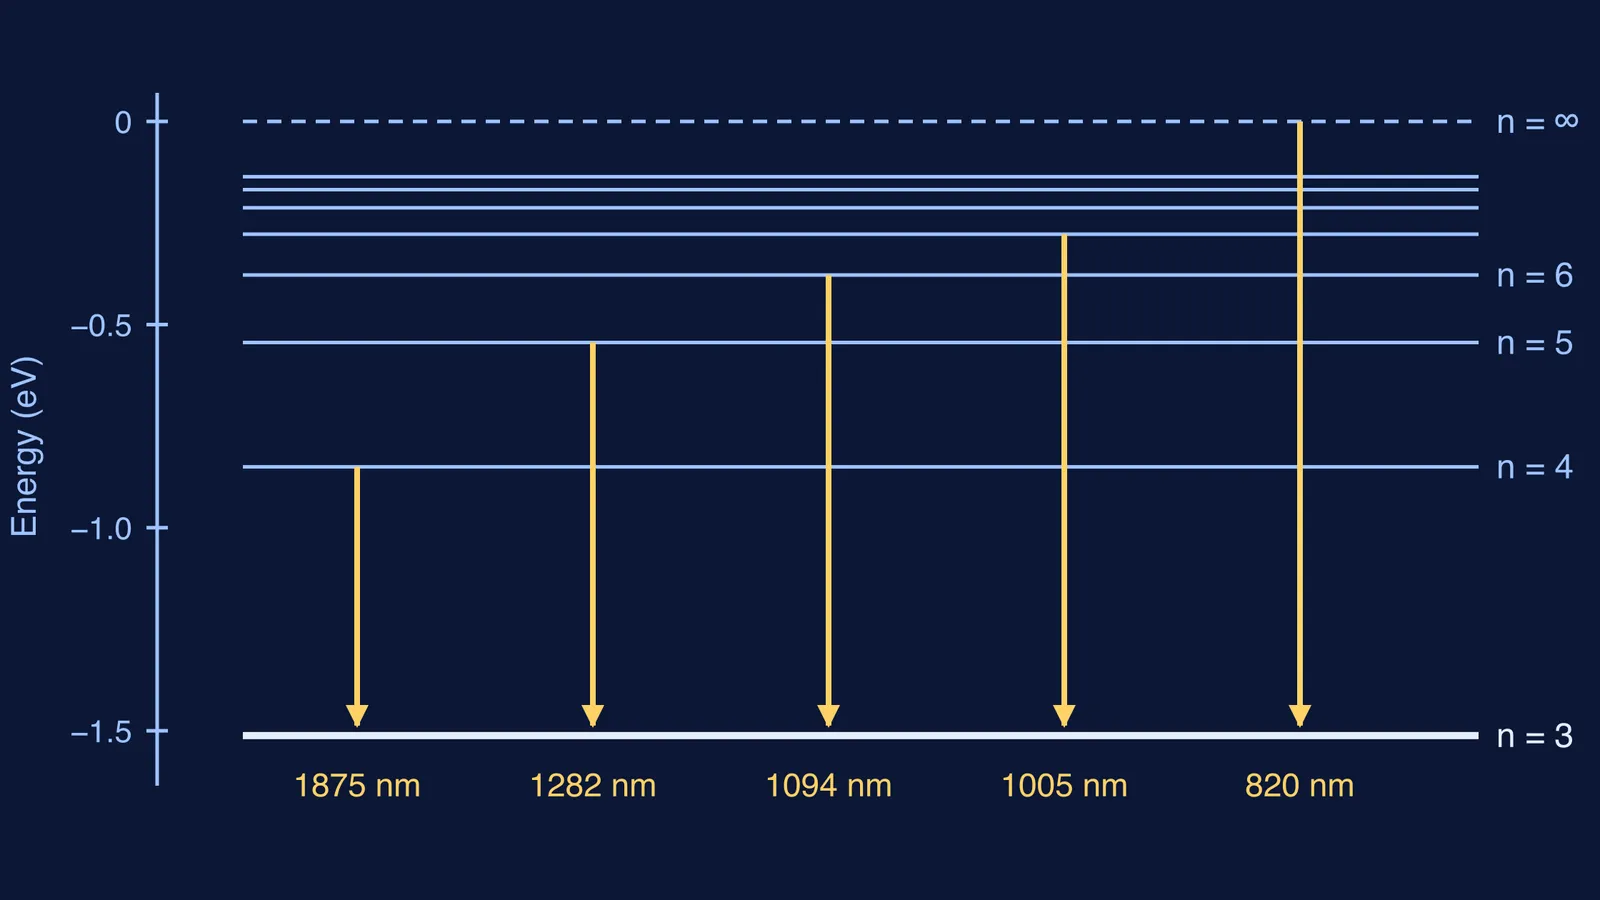
In that paper Paschen reported two hydrogen lines, at 18,751 Å and 12,818 Å, or about 1875 nm and 1282 nm, as the American physicist Frederick Brackett summed up in 1922 (Brackett's 1922 paper, transcribed by ChemTeam). They became the first two members of the Paschen series. Both lie beyond the red end of the visible spectrum, so no eye could have spotted them.
How did Paschen find lines nobody could see?
He knew where to look. Brackett wrote that the lines were “so faint that in order to observe them Paschen found it necessary to set the spectrograph in the correct position according to the wave-length predicted by Ritz in consequence of his combination principle” (same source). Walther Ritz had a rule for combining known spectral terms into new lines, and it pointed to these wavelengths.
For how a spectrometer spreads light out by wavelength, see our piece on why a prism splits white light into colours.
The series grew later. In 1922 Brackett reported “three and probably four additional members of the Paschen series” (same source). Brackett and August Pfund then found new hydrogen series even further into the infrared, in 1922 and 1924 (overview of hydrogen spectral series).
Why does the Paschen series end on n = 3?
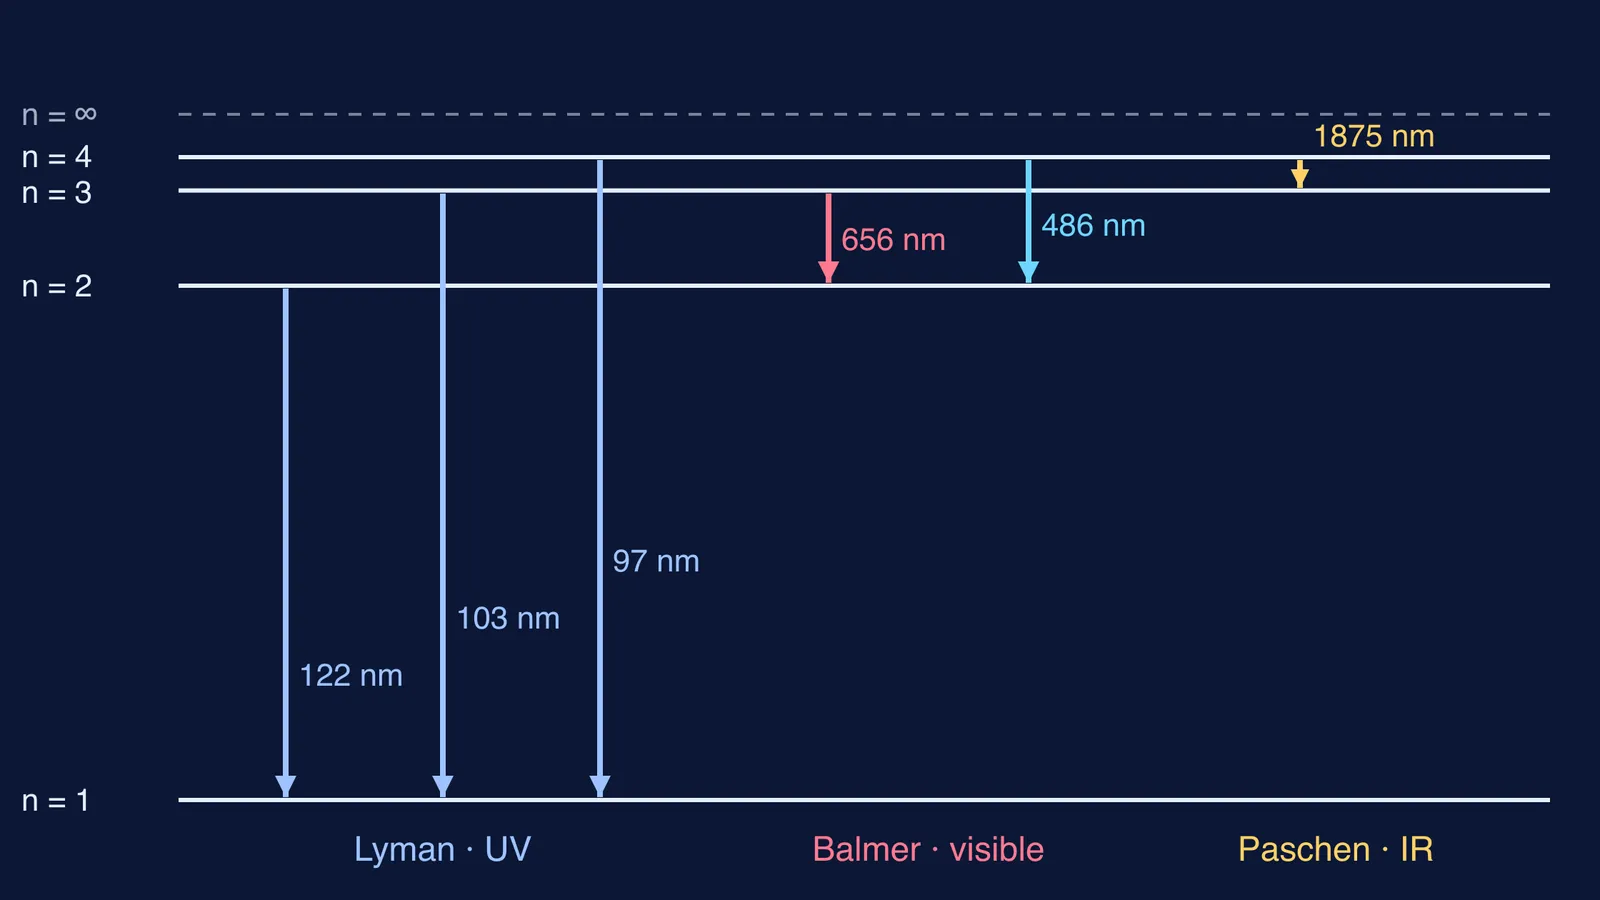
In 1908 there was no physical model of why hydrogen made these lines. That came in 1913, when Niels Bohr published “On the constitution of atoms and molecules” in the Philosophical Magazine (Crossref record of Bohr's 1913 paper). In his formula, putting the lower level at 2 gave “the ordinary Balmer series”, and putting it at 3 gave “the series in the ultra-red observed by Paschen and previously suspected by Ritz” (Bohr's 1913 paper, transcribed by ChemTeam).
So a Paschen line is the light given out when hydrogen's electron drops from n = 4, 5, 6 or higher down to n = 3. In Bohr's model the levels sit at E = −13.6 eV/n², where 13.6 eV is the Rydberg energy (NIST value of the Rydberg energy, 13.605693 eV). From n = 3 upwards the levels are crowded together, so each drop releases little energy and the light comes out at long, infrared wavelengths. Our explainer on why hydrogen's electron energy is negative shows where the −13.6 eV comes from.
How do you calculate a Paschen wavelength?
Use the Rydberg formula, 1/λ = R(1/n₁² − 1/n₂²), where n₁ is the lower level and n₂ the upper one (overview of hydrogen spectral series). For every Paschen line, n₁ = 3. The Rydberg constant is R = 1.0974 × 10⁷ m⁻¹ to four decimal places (NIST CODATA 2022 Rydberg constant).
Worked example: the first Paschen line, n₂ = 4 to n₁ = 3.
Bracket term: 1/9 − 1/16 = (16 − 9)/144 = 7/144.
Multiply: 1/λ = 1.0974 × 10⁷ × 7/144 = 5.335 × 10⁵ m⁻¹.
Invert: λ = 1/(5.335 × 10⁵) = 1.874 × 10⁻⁶ m, about 1875 nm.
That lands within a nanometre of the 18,751 Å line Paschen measured in 1908. As n₂ grows without limit, 1/n₂² goes to zero, so 1/λ = R/9 and λ = 9/R ≈ 820 nm. That series limit is the shortest Paschen wavelength, so every Paschen line falls between about 820 nm and 1875 nm.
How do you check a series question in four steps?
Find the landing level. That names the series.
Longest wavelength means the smallest jump: from n₁ + 1 down to n₁.
Shortest wavelength means the series limit: from infinity down to n₁, so λ = n₁²/R.
When a question asks for a ratio, write both 1/λ values and let R cancel. For Paschen, longest over shortest is (1/9) ÷ (7/144) = 16/7, about 2.29.
If the jumps are hard to picture, the Fermi Simulation Lab has interactive simulations for ideas that are easier to see than to read. For practice, the Fermi Problem Library has worked problems with a step-by-step solver that explains the reasoning rather than printing an answer.
Bohr's picture gets hydrogen's series right, but it does not work for every atom. Read where the Bohr model breaks, and why next.