On this page
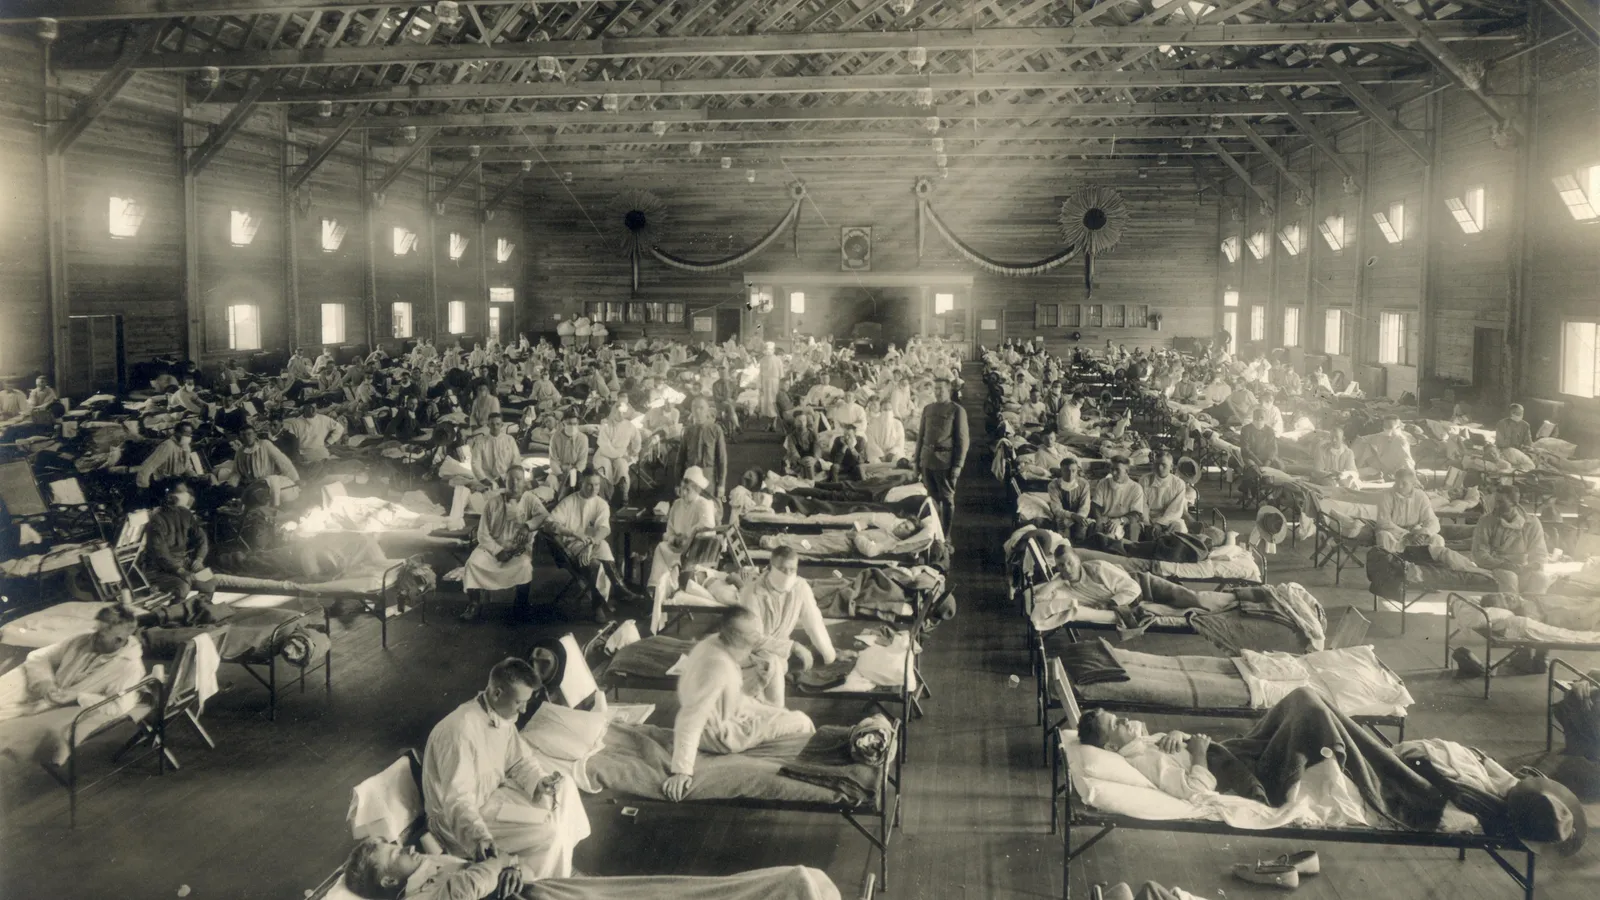
The US Centers for Disease Control calls the 1918 influenza pandemic the most severe pandemic in recent history. It estimates that about 500 million people, one-third of the world's population, were infected, and at least 50 million died, about 675,000 of them in the United States. India, by the historian David Arnold's reckoning, lost more lives than any other country.
What was the 1918 flu pandemic?
It was a pandemic caused by an H1N1 influenza virus with genes of avian origin, at a time when there was no influenza vaccine and no antibiotics for the bacterial infections that can follow it (CDC). Case-fatality rates were above 2.5%, against under 0.1% in other influenza pandemics (Taubenberger and Morens, Emerging Infectious Diseases, 2006). Control relied on isolation, quarantine, hygiene, disinfectants and limits on public gatherings, applied unevenly (CDC).
How many waves did the 1918 flu have?
Three. A spring wave began in March 1918; illness rates were high, but death rates in most places were not much above normal. A second wave spread globally from September to November 1918 and was highly fatal. In many countries a third wave followed in early 1919 (Taubenberger and Morens, 2006).
Why did so many young adults die?
Influenza usually kills mostly the very young and the very old, giving a U-shaped mortality curve. In 1918 the curve was W-shaped, with a third peak in adults roughly 20 to 40 years old. Nearly half of the influenza-related deaths were in that age group, people under 65 accounted for more than 99% of excess influenza-related deaths in 1918–1919, and for ages 15 to 34 influenza and pneumonia death rates were more than 20 times higher than in previous years (Taubenberger and Morens, 2006).
Michael Worobey, Guan-Zhu Han and Andrew Rambaut argued from influenza phylogenies that many adults born around 1880–1900 may have lacked protection because their childhood exposure had been to an antigenically distinct H3N8 virus, while people born earlier or later would have had some protection (PNAS, 2014). Separately, David Morens, Jeffery Taubenberger and Anthony Fauci examined lung tissue from 58 autopsies and reviewed 109 published autopsy series covering 8,398 autopsies, and concluded that most deaths likely resulted directly from secondary bacterial pneumonia (Journal of Infectious Diseases, 2008).
Epidemic modellers still study how past infections shape who falls ill next; see Sunetra Gupta and the maths of how infectious strains compete.
How bad was it in Bombay and in India?
Bombay is thought to have been the virus's entry point into India. Siddharth Chandra and Eva Kassens-Noor, drawing on the Sanitary Commissioner's annual report, date the start of Bombay's second wave to the week of 7–14 September 1918, with a peak in the week of 29 September to 5 October; the provincial death rate in the Bombay Presidency was 54.9 per thousand people (BMC Infectious Diseases, 2014).
For India as a whole, they cite estimates of 10 to 20 million deaths, with a point estimate of 13.8 million for the British-controlled provinces. Arnold puts it at at least twelve million lives, more than in any other country. Estimates get revised: using census data, Chandra, Goran Kuljanin and Jennifer Wray found the long-standing Davis estimate for British India overstated by at least 24% (Demography, 2012).
What did the reconstructed virus show?
The virus was gone, but fragments of its RNA survived in preserved autopsy tissue. From 1995 a team sequenced them and eventually determined the complete genome of one 1918 virus and partial sequences of four others (Taubenberger and Morens, 2006).
In 2005, under strict biosafety containment at CDC, researchers built and studied a virus carrying all eight 1918 gene segments. It grew far more than comparison viruses in human lung cells and in the lungs of mice, and swapping its haemagglutinin gene for one from a modern seasonal flu virus stopped it killing mice. The authors concluded that the 1918 genes acting together produced its high virulence (Tumpey and colleagues, Science, 2005; CDC's account).
How can you check a pandemic number yourself?
A rate is only useful if you can turn it back into people. Try the Bombay Presidency figure.
Write the rate as a fraction: 54.9 deaths per 1,000 people is 0.0549 deaths per person.
Pick a population you know. A town of 40,000.
Multiply: 40,000 × 0.0549 ≈ 2,196 deaths at that rate.
Compare with a normal year for the same place before deciding what is "excess".
Ask who counted, and whether the cause of death was recorded at all.
For practice with rates, try exponential growth equations and solved numericals. For the biology underneath, the Fermi Concept Library covers every concept in physics, chemistry, biology, mathematics and computing, and the Fermi Problem Library has a step-by-step solver that explains the reasoning rather than printing an answer.
For an earlier case of public health measures working before the science was settled, read about Wu Lien-teh, the Manchurian plague and the gauze mask.