On this page
Four NCERT Biology graphs are worth practising for NEET-UG: enzyme activity, photosynthesis rate, population growth and the menstrual cycle hormone chart. Each hides a reading trap, not a memory one: the axis is not what you assumed, or the flat part means something other than "stopped". Here is one routine for all four, with the NCERT facts behind each trap.
How do you read a graph in a biology exam question?
Use the same four steps every time, before you look at the options:
Name both axes. Is the y-axis a rate, an amount, or a level with no units?
Split the curve. Mark the rising, flat and falling parts.
At each flat part, ask what is in short supply. That is the limiting factor.
Only now read the options. Wrong ones often describe a different part of the curve or a different axis.
What does an enzyme activity graph show?
NCERT's Figure 9.5 plots enzyme activity against pH, against temperature, and against substrate concentration (NCERT Class 11 Biology, Biomolecules).
The pH and temperature curves are humps: highest activity at the optimum, declining on both sides. The two sides differ. NCERT says low temperature preserves the enzyme in a temporarily inactive state, while high temperature destroys activity because proteins are denatured by heat. If an option says cooling denatures the enzyme, it is reading the wrong side of the hump.
The substrate curve rises, then flattens at a maximum velocity, Vmax. The substrate has not run out: NCERT explains that enzyme molecules are fewer than substrate molecules, so once every enzyme is busy, extra substrate has nothing free to bind. On the same figure, Km is the substrate concentration at which velocity is half of Vmax. See our explainer on why enzyme rate levels off as substrate rises.
Why does the photosynthesis rate stop rising?
NCERT Class 11 states Blackman's (1905) Law of Limiting Factors: if a chemical process is affected by more than one factor, its rate is set by the factor nearest its minimal value (NCERT Class 11 Biology, Photosynthesis in Higher Plants).
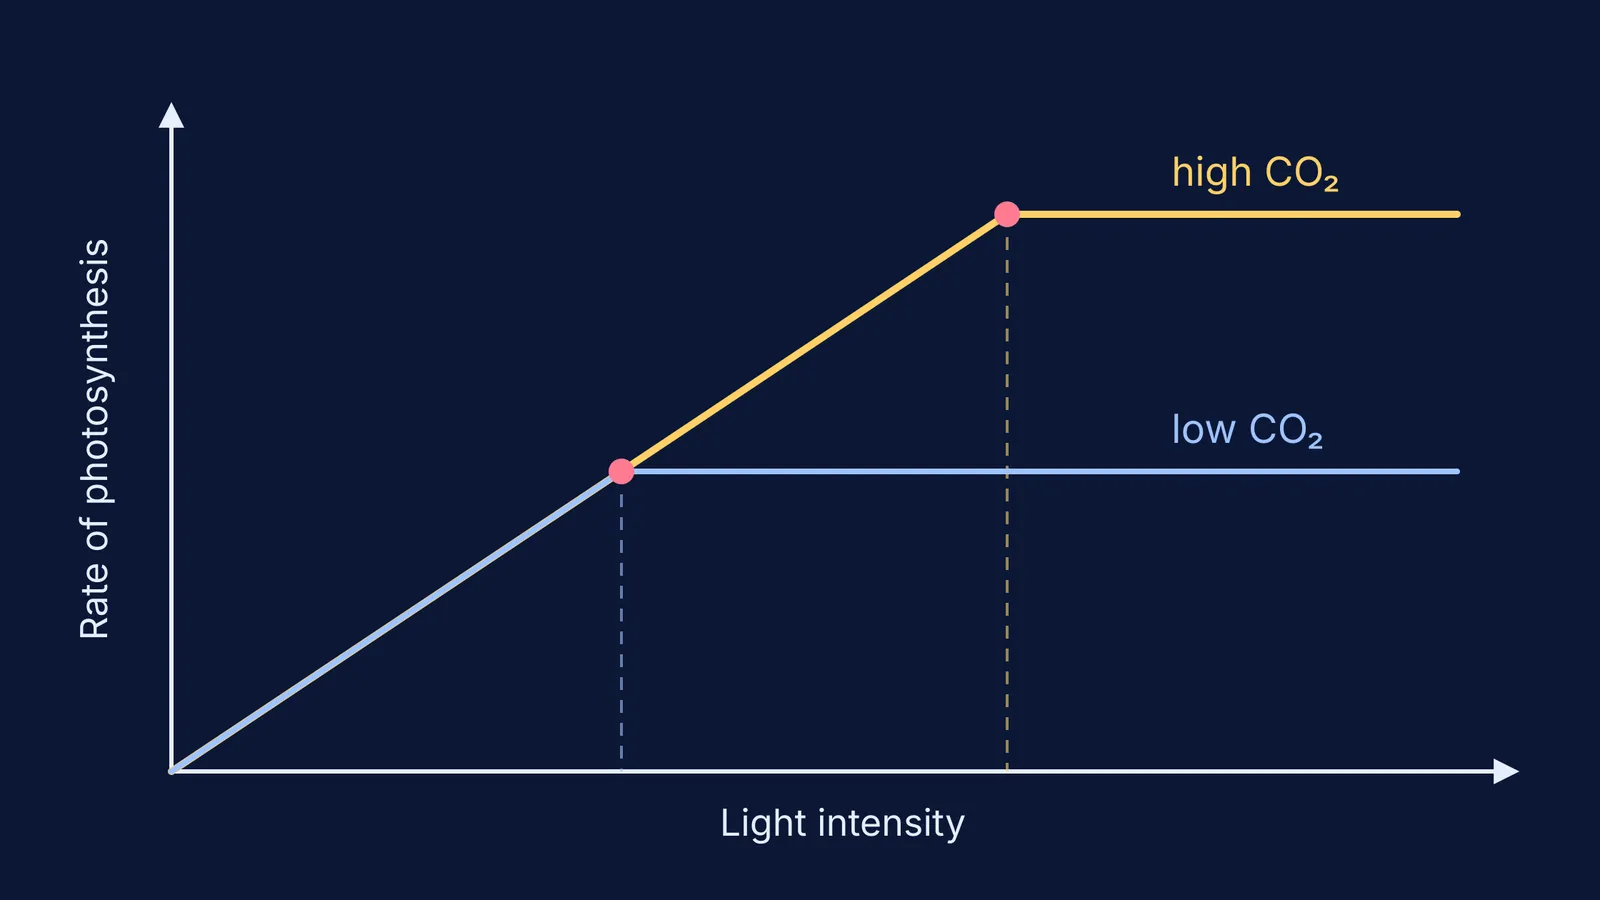
In its light-intensity graph (Figure 11.10), the rate rises in a straight line at low light, then levels off as other factors become limiting. Numbers from the same chapter:
Light saturation occurs at about 10 per cent of full sunlight, so light rarely limits except in shade or dense forest.
Atmospheric CO2 is between 0.03 and 0.04 per cent, and NCERT calls CO2 the major limiting factor for photosynthesis.
C4 plants saturate at about 360 µL per litre of CO2, while C3 plants keep responding beyond 450 µL per litre.
Worked example. In the diagram at the top of this page, two curves share one rising line, then flatten at different heights. On the rising part, more CO2 changes nothing; light is limiting. On the lower plateau, more light changes nothing; CO2 is limiting, which is why the high-CO2 curve keeps rising. An option saying "light limits the rate at the plateau" is wrong. For a hands-on version, see our photosynthesis limiting-factors simulation.
How do you tell J-shaped from S-shaped population growth?
NCERT Class 12 gives two models (NCERT Class 12 Biology, Organisms and Populations). Exponential growth, dN/dt = rN, gives a J-shaped curve with unlimited resources. Logistic growth, dN/dt = rN(K − N)/K, gives a sigmoid curve levelling off at the carrying capacity, K. NCERT notes that r is 0.015 for the Norway rat and 0.12 for the flour beetle.
Two traps. First, check whether the y-axis is N (population size) or dN/dt (growth rate). Second, the flat top of the S-curve does not mean births have stopped; the population has reached K, where (K − N)/K is zero. From the same equation, growth is fastest at N = K/2. Our post on yeast populations hitting a food limit shows the S-curve forming.
How do you read the menstrual cycle hormone graph?
NCERT's Figure 2.9 stacks four panels on one day axis: pituitary hormones, ovarian events, ovarian hormones and the uterus (NCERT Class 12 Biology, Human Reproduction). The text says the cycle repeats at an average interval of about 28 or 29 days. LH and FSH both peak in the middle of the cycle, around day 14, and the LH surge causes the Graafian follicle to rupture and release the ovum. In the luteal phase, the corpus luteum secretes large amounts of progesterone.
The trap is the panels: pituitary and ovarian hormones sit on separate scales with no units. Compare timing and shape, never heights across panels. Read down a vertical line: LH peaks, then ovulation happens, then progesterone rises.
If a term on the axis is the problem, such as Km or carrying capacity, look it up in the Fermi Concept Library, where every concept has its own lesson. If you know the terms but still pick wrong options, work a few problems in the Fermi Problem Library, whose step-by-step solver explains the reasoning rather than printing an answer.
Tonight, cover the caption of one of these NCERT figures and label its axes and each plateau's limiting factor from memory.