

On this page
A photosynthesis simulation usually gives you sliders for light intensity, CO₂ concentration and temperature. Instead of dragging them at random, treat each run as a test. Before you touch a slider, say which factor is limiting, then let the graph tell you whether you were right.
What is a limiting factor in photosynthesis?
In his 1905 paper Optima and Limiting Factors in the Annals of Botany, F. F. Blackman stated an axiom: "When a process is conditioned as to its rapidity by a number of separate factors, the rate of the process is limited by the pace of the 'slowest' factor."
In the same paper, Blackman named five controlling factors for a chloroplast engaged in photosynthesis: CO₂, water, light intensity, chlorophyll and temperature. He noted that CO₂, light and temperature are comparatively easy to experiment with, and those are the three a simulation lets you vary.
He also showed how easily this goes wrong. Kreusler found that the assimilation of a warmed *Rubus* shoot rose steadily up to about 15°C and then practically never rose further. That looks like an optimum temperature, but Matthaei showed the real cause was too little light.
For exam-style questions on the law itself, read our post on Blackman's law and why CO₂ is often limiting.
How do you read the plateau on a photosynthesis graph?
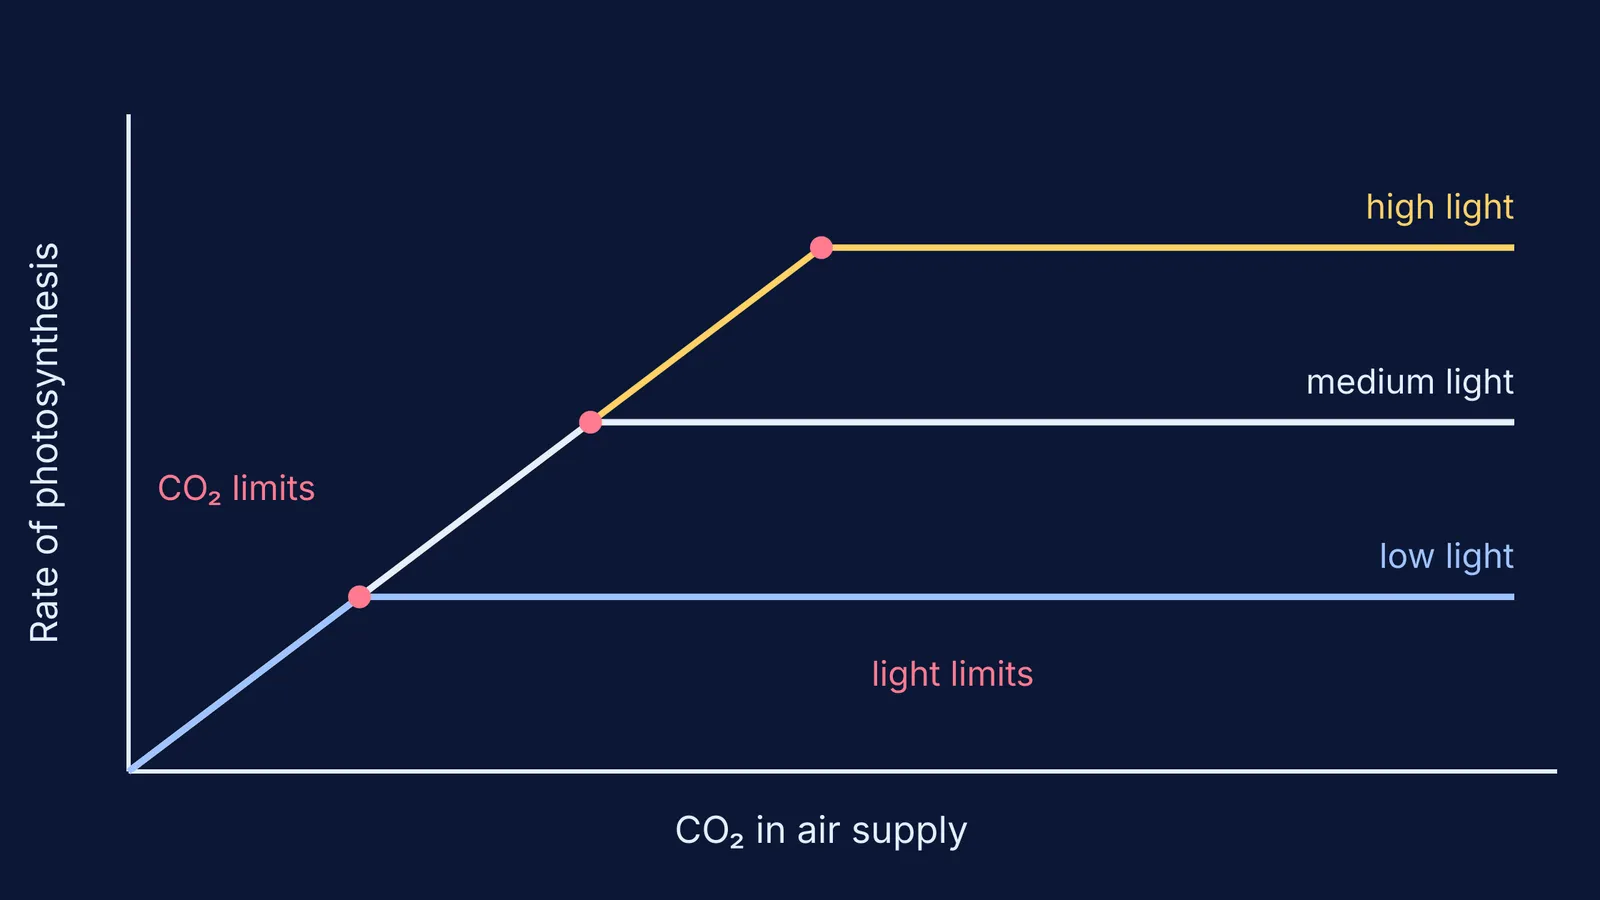
Blackman described the experiment you will run on screen (Blackman, 1905). He imagined a leaf that gets enough light to decompose 5 c.c. of CO₂ per hour. As you raise the CO₂, the rate climbs until it reaches 5 c.c., and then it stays flat, "the light being now the limiting factor". With enough light for 10 c.c. per hour, twice the CO₂ is needed to reach the plateau.
So the rule for any graph is:
Line rising: the factor on the x-axis is limiting.
Line flat: some other factor is limiting. Raise that one and the plateau moves up.
Plateau higher after you change a second slider: that second factor was the one limiting.
Blackman's sharp corners are a simplification. The later model by Farquhar, von Caemmerer and Berry (1980) describes leaf photosynthesis in terms of the enzyme Rubisco, electron transport driven by light, and a temperature-dependent upper limit to electron transport. Near the corner on your simulation, take extra readings rather than trusting a single point.
A predict-then-test plan for any simulation
Write each prediction down before you click.
Set temperature to a mild middle value and leave it there.
Set light low. Raise CO₂ in five equal steps and write down the rate each time. Predict where the line flattens and which factor caps it.
Set light to medium and repeat. Predict whether the plateau will be higher and the corner further right.
Set light high and repeat.
At the highest plateau, raise light again. If nothing changes, CO₂ or temperature is now limiting. Test each one.
Fix light and CO₂ at high values and sweep temperature from cool to hot.
A worked prediction sheet for steps 2 and 3:
Point A, low light, very low CO₂: the rate is on the rising part, so CO₂ limits.
Point B, low light, high CO₂: the rate is on the plateau, so light limits.
Point C, medium light, the same high CO₂: the plateau is higher, which confirms that light was limiting at B.
Point D, medium light, CO₂ just past the low-light corner: still rising, so CO₂ limits here, even though it didn't at the same CO₂ under low light.
The limiting factor isn't a property of the plant. It depends on where you are on the graph.
The Fermi Simulation Lab has interactive simulations for ideas that are easier to see than to read.
Why does temperature give a peak instead of a plateau?
Blackman reported Matthaei's finding that for cherry-laurel leaves at 30°C and above, the initial rate "cannot be maintained, but falls off regularly", and falls faster the higher the temperature (Blackman, 1905). Many simulations show a curve that rises, then drops. Don't call the drop "temperature limiting" in the same sense as a plateau. Blackman linked the fall to time spent at a high temperature, not to a shortage of an input.
How do you check your reasoning?
Redraw your sheet from memory the next day, then compare it with the diagram in your textbook. Our post on when simulations or static diagrams help more explains why doing both is useful. If you can explain why the corner moves right as light increases, you understand the idea. If not, ask Fermi's AI tutor. It decides whether to explain, ask or show, and checks your understanding as it goes.
For the light reactions and the Calvin cycle behind these curves, read our photosynthesis guide to light reactions, the Calvin cycle and C4.


