

On this page
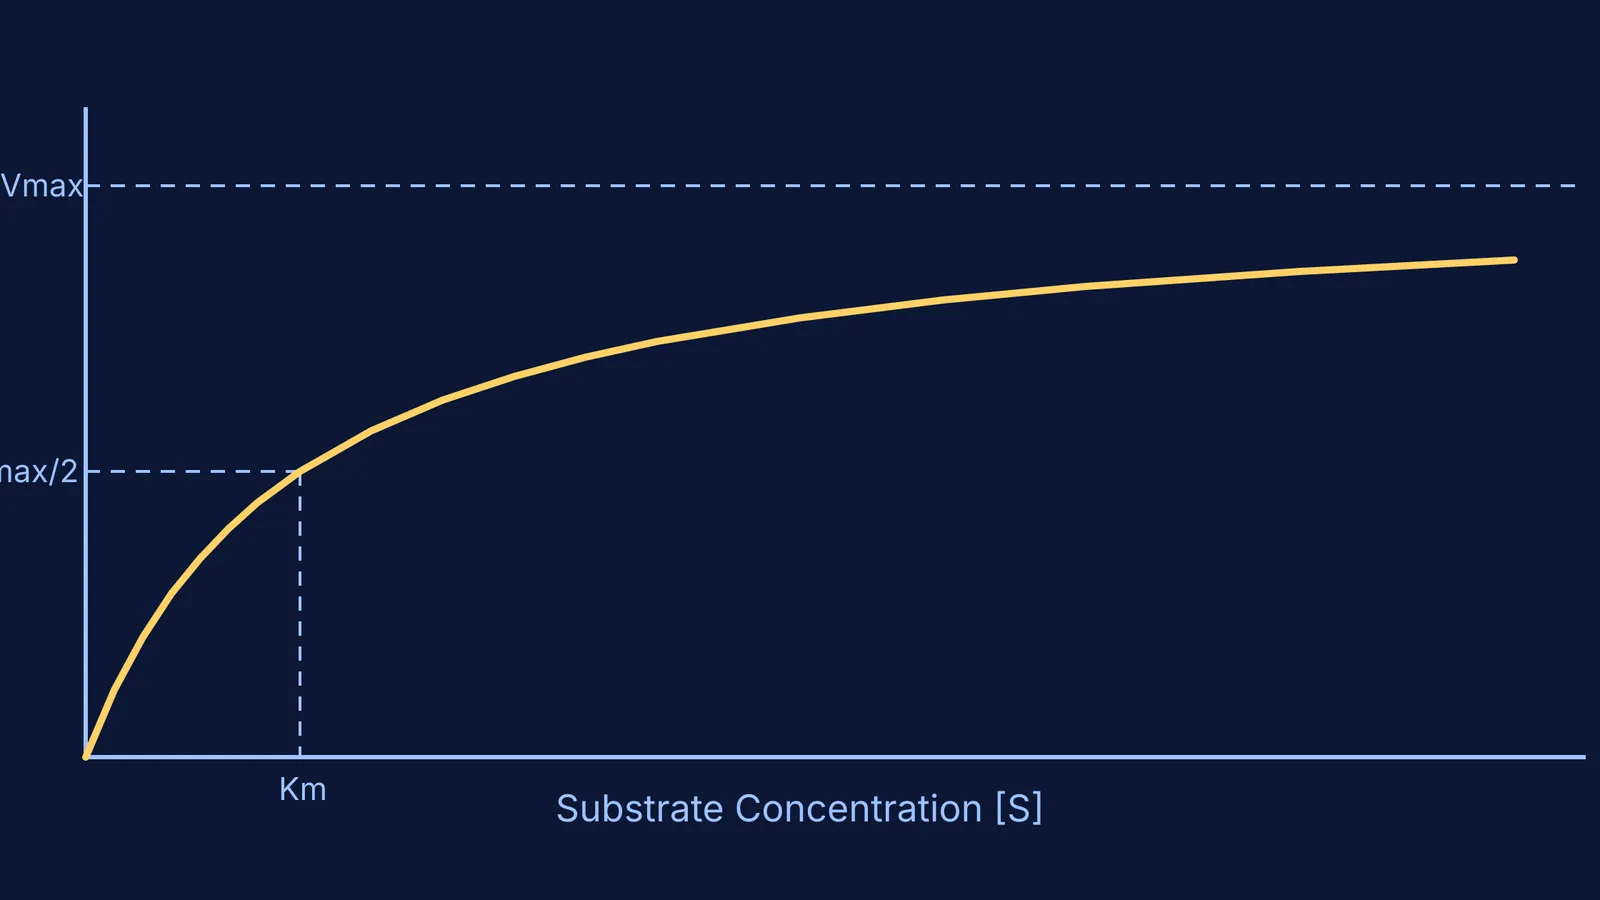
When you study for biology or chemistry exams, you will eventually see the classic curve of enzyme kinetics: a line that shoots up quickly, then bends and flattens into a horizontal plateau. This shape describes how enzymes behave when you give them more and more work to do.
What happens to enzyme rate as substrate concentration increases?
If you pour a little bit of substrate (the molecule an enzyme works on) into a solution containing enzymes, the reaction rate jumps. At low concentrations, most of the enzyme active sites are empty. Every new substrate molecule that bumps into an enzyme is instantly caught, processed, and turned into product. Because there are plenty of free enzymes waiting around, adding more substrate directly increases the speed of the reaction. In chemistry terms, this initial phase follows first-order kinetics, meaning the rate is directly proportional to how much substrate you add. The collision theory of reactions explains this well: more substrate molecules mean more frequent successful collisions with empty enzyme active sites.
But as you keep adding substrate, the rate of increase begins to slow down. The graph starts to curve. Why? Because the enzymes are getting busy. A substrate molecule now has to wait a fraction of a second to find an empty active site. The enzymes are still working just as fast as before, but the overall system is starting to reach its limit.
Why does the reaction rate level off?
Eventually, you reach a point where adding more substrate makes no difference to the speed at all. The reaction rate has leveled off at a maximum speed, called Vmax.
At this point, the enzyme is saturated. Every single active site is occupied. The moment an enzyme releases a finished product, another substrate molecule instantly binds to it. Enzymes are physical protein machines—a fact proven by James Sumner and his urease crystals—and they have physical speed limits. Once they hit that limit, the system is working at its absolute maximum capacity. This zero-order kinetics phase means the rate is completely independent of substrate concentration. It depends entirely on the turnover number of the enzyme, which is the absolute maximum number of substrate molecules a single enzyme can convert into product per second.
Think of it like a supermarket checkout. If there are ten cashiers and only two customers, adding a third customer increases the checkout rate. But if there are a hundred customers, all ten cashiers are ringing up items as fast as humanly possible. Adding fifty more customers to the line will not speed up the cashiers; it just makes the queue longer.
The Michaelis constant (Km) is defined as the exact substrate concentration at which a reaction runs at half of its maximum velocity, a relationship first quantified in a landmark 1913 paper by Leonor Michaelis and Maud Menten. This laid the foundation for modern biochemistry. You can read more about how they derived this in our post on Michaelis, Menten and the equation for enzyme speed.
How to test this in a simulation
If you are having trouble picturing how these collisions work in real time, the Fermi Simulation Lab has interactive simulations for the ideas that are easier to see than to read. You can manipulate the environment yourself to see exactly when and why the enzymes max out.
Here is a simple plan to set up your own experiment:
Open the enzyme kinetics simulation and set a fixed number of enzymes (for example, keep the enzyme concentration constant at 50 units).
Start with a very low substrate concentration. Record the number of products formed per second.
Slowly move the substrate slider to the right. You will notice the product rate climbing fast as empty enzymes quickly bind to the new molecules.
Keep pushing the substrate concentration higher. Watch the animation of the enzymes closely. You will see that they are never empty—they are constantly bound to a substrate molecule. The product rate on your graph will flatten into a straight horizontal line, hitting Vmax.
If you change the type of enzyme in the simulation, you might see the curve stretch or compress, indicating a different Km or Vmax. However, the fundamental shape of the curve remains exactly the same across almost all of the six enzyme classes. Knowing how to read this saturation curve helps you predict how enzymes will behave under different conditions, whether you are solving a chemical kinetics numerical or studying how digestion works in the human body.


