

On this page
In school biology practicals and competitive exam prep, growing baker's yeast (*Saccharomyces cerevisiae*) in liquid broth seems straightforward: add sugar, seal the flask, and watch carbon dioxide bubbles foam up. But if you track cell density over several days, the population does not stay at a stable carrying capacity. Instead, after a rapid surge, the population experiences a steep crash. Understanding the metabolic bottleneck in a closed, anaerobic flask connects Class 12 organisms and populations growth models to real biochemical limits.
Why does yeast growth slow down in a sealed flask?
When yeast cells enter a fresh nutrient medium, they do not divide immediately. During the initial lag phase, cells synthesize ribosomal subunits, transporters, and enzymes to prepare for reproduction. Once adapted, the population enters the exponential phase, budding rapidly; under optimal batch conditions documented in the *Journal of Experimental Biology* by G. F. Gause (1932), *Saccharomyces cerevisiae* exhibited an intrinsic growth rate of roughly 0.22 per hour, doubling approximately every 3.2 hours.
As the population density rises, the per capita reproduction rate decreases. Standard textbooks model this decelerating phase using Pierre Verhulst's logistic growth model, where the growth rate dN/dt = rN(1 − N/K) slows down as the population N approaches the carrying capacity K. In a sealed flask, however, K is not a permanent environmental limit; it is dictated by the finite initial sugar supply. As glucose concentration drops toward zero, cell division halts.
How does initial sugar concentration change the peak population?
In a closed flask, carrying capacity is directly proportional to initial nutrient mass. In a classic 1949 review in the *Annual Review of Microbiology*, Jacques Monod established that total microbial yield scales directly with the initial concentration of the growth-limiting nutrient.
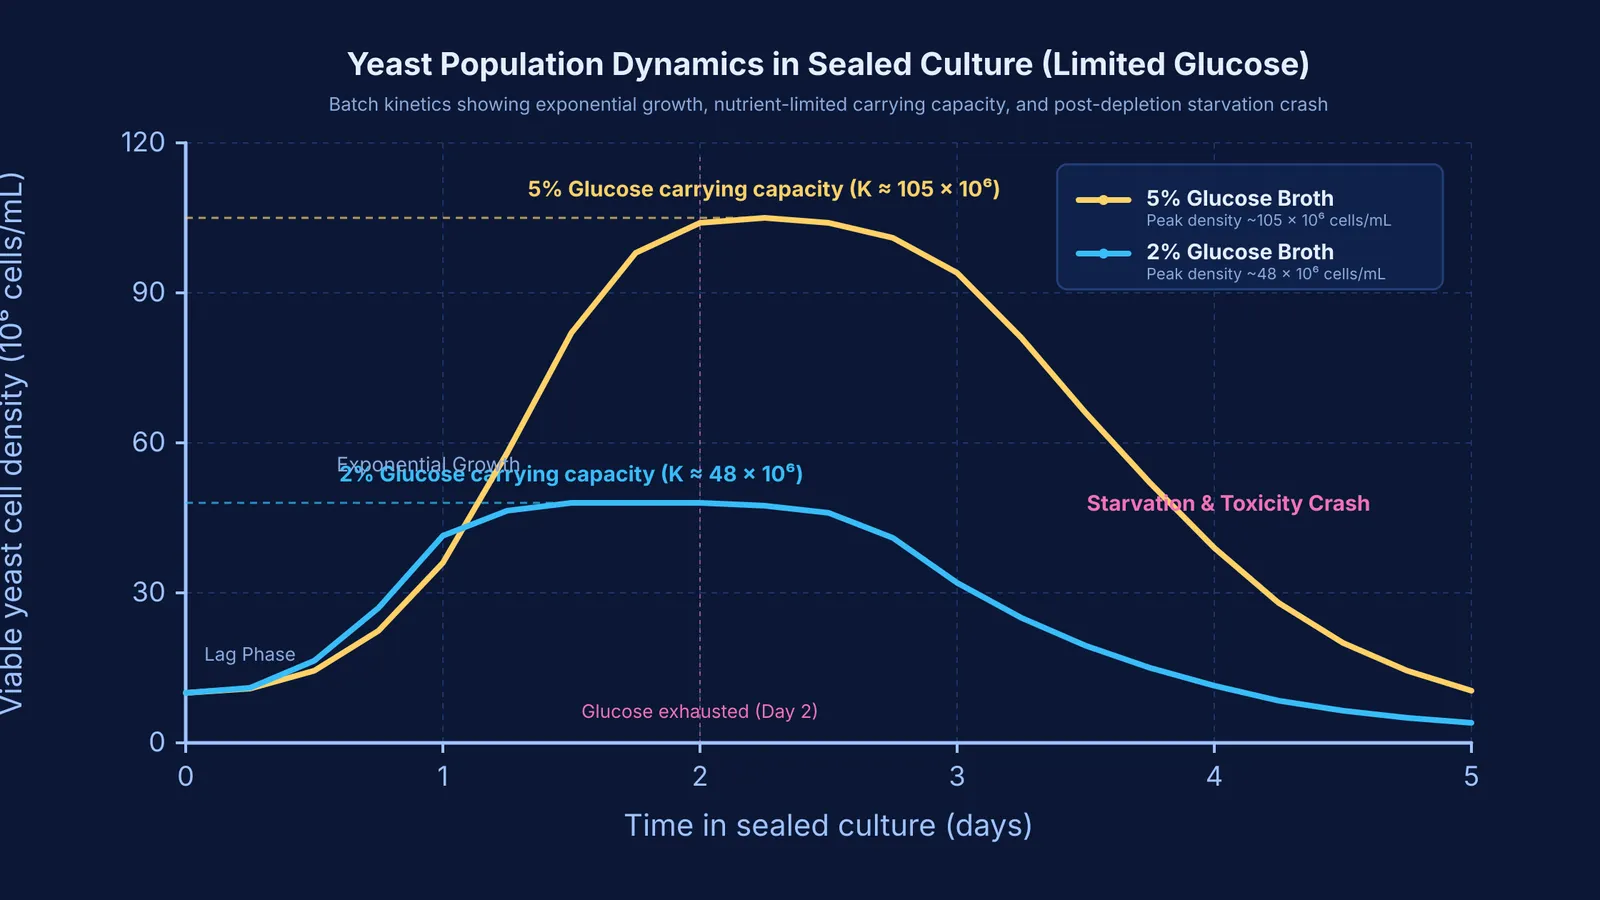
Starting with 2% glucose (20 g/L) typically yields a peak density of roughly 45 to 50 × 10⁶ cells/mL before sugar is exhausted within 36 hours. Increasing the concentration to 5% glucose (50 g/L) provides more carbon substrate, enabling a peak of approximately 100 to 110 × 10⁶ cells/mL around 48 hours.
However, adding unlimited sugar does not produce runaway growth. As shown by R. H. De Deken in the *Journal of General Microbiology*, yeast cells exposed to glucose concentrations above 0.1 g/L ferment sugar into ethanol and carbon dioxide via the Crabtree effect. When initial sugar exceeds 15% to 20%, hyperosmotic stress draws water out of cells, prolonging the lag phase and suppressing cell division.
Why does the yeast population crash when sugar runs out?
In an open flask, yeast exhibits a two-phase growth pattern known as a diauxic shift. Once glucose is exhausted, cells switch to consuming ethanol using oxygen. But in a sealed flask, dissolved oxygen is rapidly consumed during early metabolic activity, locking the culture into anaerobic fermentation.
As shown by Ishtar Snoek and H. Yde Steensma in *Yeast*, *Saccharomyces cerevisiae* cannot respire ethanol without molecular oxygen as an electron acceptor. Furthermore, anaerobic yeast cells cannot synthesize essential membrane lipids like ergosterol. The accumulated ethanol remains trapped in the broth as a toxic waste product.
When glucose reaches zero, cells enter stationary phase. In a review in *Microbiological Reviews*, M. Werner-Washburne and colleagues explained that starving yeast cells arrest the cell cycle in G0/G1 and temporarily survive by metabolizing internal glycogen and trehalose reserves. Within 2 to 3 days, these energy stores run out. Unable to produce maintenance ATP, cells cannot maintain membrane proton gradients. Trapped ethanol fluidizes cell membranes, triggering ion leakage and rapid autolysis.
How can you predict the daily yeast count and crash point?
Following the quantitative batch culture methods formalized in the *Annual Review of Microbiology*, you can predict and test this 5-day cycle in a sealed flask containing 2% glucose broth inoculated at 10 × 10⁶ cells/mL:
Day 0 (0–6 hours): Lag phase; cells synthesize enzymes with minimal cell division.
Day 1 (24 hours): Exponential growth reaches roughly 40 to 45 × 10⁶ cells/mL with vigorous foaming.
Day 2 (48 hours): Glucose is exhausted (0%); division halts at the peak carrying capacity of ~48 × 10⁶ cells/mL.
Day 3 (72 hours): Internal glycogen depletes; viable cell density begins sliding toward ~30 × 10⁶ cells/mL.
Days 4–5 (96–120 hours): The population crashes below 10 × 10⁶ viable cells/mL as cell membranes fail.
Exploring biological processes—from Eduard Buchner's experiments on fermentation to nonlinear population ecology—is much easier when you can test variables interactively. The Fermi Simulation Lab provides interactive simulations for ideas that are easier to see than to read, letting you vary initial sugar concentrations and watch population curves and starvation crashes unfold. When growth kinetics or exam numericals feel challenging, Fermi's AI tutor can work out what you already know and build a plan for the session, helping you master ecological modeling step by step.


