On this page
Your NCERT Class 12 Biology book opens its chapter on populations with a sentence that sets up a whole family of exam questions: "A population has certain attributes whereas, an individual organism does not." It sits in section 11.1.1 of Chapter 11, Organisms and Populations. Once you see why it is true, these questions get much easier.
What is a population in NCERT's sense?
NCERT describes a population as individuals of a species that live in a well-defined geographical area, share or compete for similar resources and can potentially interbreed (NCERT, Chapter 11). Cormorants in a wetland and lotus plants in a pond are two of its examples.
The key line follows: "An individual may have births and deaths, but a population has birth rates and death rates." A single lotus plant can be born and can die. It cannot have a birth *rate*, because a rate needs a group to divide by.
Which population attributes does an individual not have?
Section 11.1.1 works through four of them:
Birth rate: births per member of the population over a stated time (a per capita rate).
Death rate: deaths per member over a stated time.
Sex ratio: the share of females and males. An individual is either male or female; only a group has a ratio.
Age distribution: the percentage of individuals in each age group, drawn as an age pyramid.
How do you calculate birth rate and death rate from NCERT's numbers?
Both of NCERT's worked examples use one recipe: the change in number divided by the starting population, with the time period stated (NCERT, section 11.1.1).
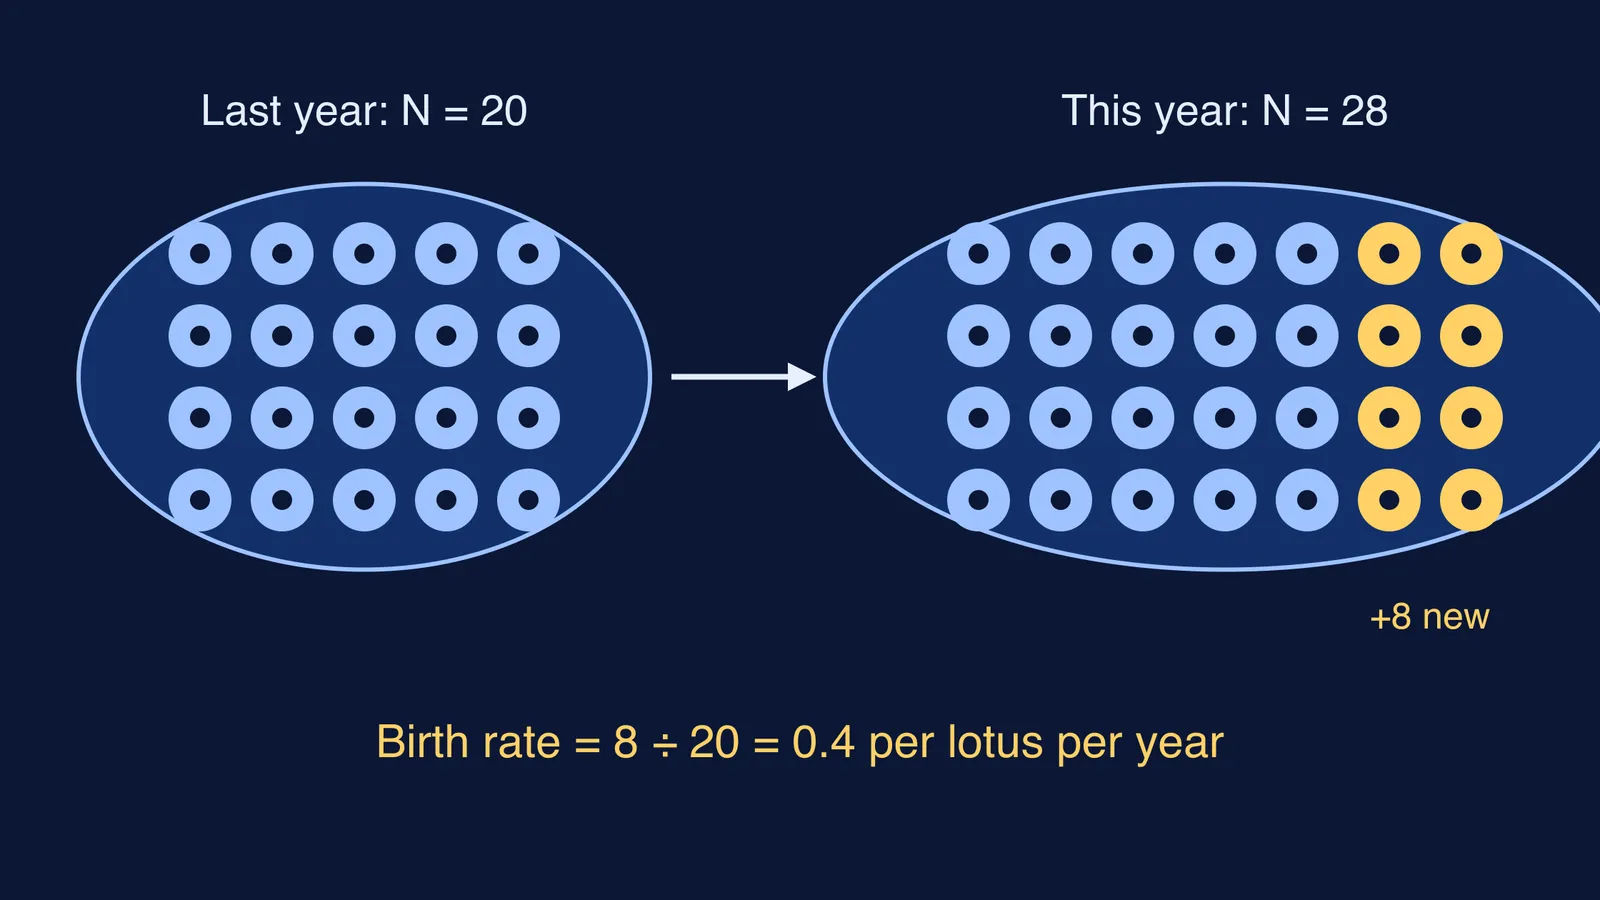
Lotus pond. Last year the pond had 20 lotus plants. Reproduction added 8 new plants, so there are now 28. Birth rate = 8 ÷ 20 = 0.4 offspring per lotus per year.
Fruit flies. A laboratory population of 40 fruit flies loses 4 in a week. Death rate = 4 ÷ 40 = 0.1 individuals per fruit fly per week.
Two traps catch students. Divide by the starting number (20), not the new total (28): 8 ÷ 28 gives about 0.29, which is wrong. And keep the unit: "0.4" alone is incomplete, "0.4 per lotus per year" is the answer. For more drills like these, see our post on population growth rate calculations.
What does a tiger count tell you, and what doesn't it?
Wild populations are rarely counted one by one. NCERT notes that the tiger census in national parks and tiger reserves is often based on pug marks and fecal pellets (NCERT, Chapter 11); we explain how in India's tiger census and pug marks.
A July 2026 Press Information Bureau backgrounder charts India's tiger population at 2,967 in 2018 and 3,682 in the All India Tiger Estimation 2022, and labels the trend a 6% annual growth rate (PIB, India Leads the Wilderness in Tiger Conservation).
Try the NCERT recipe on those numbers. The change is 3,682 − 2,967 = 715 tigers. Per tiger, that is 715 ÷ 2,967 ≈ 0.24 over four years, or about 0.06 per tiger per year as a simple average, close to the 6% label (compounded yearly, it is about 5.5%).
But this is not a birth rate. NCERT's growth equation is N(t+1) = N(t) + [(B + I) − (D + E)]: births and immigration add to the population, deaths and emigration take away. Two counts four years apart give you only the net result. To get a tiger birth rate you would need births counted on their own, the way the lotus example tells you the 8 new plants came from reproduction.
How do sex ratio and age pyramids show up in questions?
NCERT's sex-ratio example is a population in which 60 per cent are females and 40 per cent males (NCERT, section 11.1.1). No single fruit fly or tiger can be "60 per cent female", which is exactly the point.
Plot the age distribution and you get an age pyramid, split into pre-reproductive, reproductive and post-reproductive groups. NCERT's Figure 11.1 shows three shapes for human populations: expanding, stable and declining. Our guide to reading population age pyramids walks through each one.
A quick checklist before you answer
Run through this on any "attribute of a population" or assertion-reason question:
Is it one event (a birth, a death) or a rate per member over time? Only the rate is a population attribute.
Did you divide by the starting population and state the time unit?
Is it net change between two counts? Then it mixes births, deaths, immigration and emigration.
Is it a ratio or percentage across individuals, like sex ratio or age distribution? Population attribute.
Could one organism have it, like age, sex or body size? Individual trait.
If any of the four attributes still feels shaky, the Fermi Concept Library gives each biology concept its own lesson and its place in the map. When you want to check your working on a numerical, the Fermi Problem Library has a step-by-step solver that explains the reasoning rather than printing an answer.