On this page
You cannot line tigers up and count them. So ecologists count what tigers leave behind, then use careful arithmetic to turn those signs into a number.
Why is population size often estimated indirectly?
NCERT's Class 12 chapter Organisms and Populations says: "We are mostly obliged to estimate population sizes indirectly, without actually counting them or seeing them." The same page gives the tiger example: the tiger census in our national parks and tiger reserves "is often based on pug marks and fecal pellets."
Population density does not have to be a head count. For one huge banyan among many small plants, the chapter says per cent cover or biomass is more meaningful. For some questions, relative densities "serve the purpose equally well", such as the number of fish caught per trap in a lake.
What are pug marks and faecal pellets, and how are they used?
Pug marks are the footprints of big cats. Faecal pellets (scat) are their droppings. Both tell you a tiger used a patch of forest, even if nobody saw it.
Pug marks show up on dusty trails, forest roads and stream beds. How often you find them per kilometre walked becomes an index of how many tigers are around.
Scat can be collected and tested. In India's 2022 survey, where camera trapping was not possible and tiger densities were very low, DNA extracted from scats was used to confirm that tigers were present (NTCA and WII summary report, 2022).
For decades, Indian forest managers tried to tell individual tigers apart from pugmark tracings and add them up. A 2003 paper by K. Ullas Karanth and colleagues in Animal Conservation (Karanth et al., 2003) evaluated this "pugmark census method", used for three decades, and concluded that it aimed for an absolute count but failed to achieve it. They proposed sampling-based methods instead. Our profile of Ullas Karanth and how camera traps learned to count tigers tells the rest of that story.
What does relative density mean?
Relative density compares how common an animal is between places or years without saying exactly how many there are. If forest X gives 0.6 tiger signs per km walked and forest Y gives 0.3, X probably has more tigers. That comparison only holds if signs are equally easy to find in both forests. Rocky ground holds fewer prints, and rain washes scat away.
How does India's tiger estimation turn signs into a number?
The Status of Tigers 2022 summary report describes three phases:
Ground surveys: forest staff walked 93,382 trails covering 4,65,360 km, recording carnivore signs, prey, vegetation and dung counts.
Satellite data: forest cover, roads, night lights and other habitat and human-impact measures.
Camera traps at 32,588 locations, which photographed 3,080 unique tigers.
The report calls its method "a derivation of double sampling concept", in which sign counts from the whole area "are calibrated against absolute density obtained from limited samples." Camera traps give density in some places; sign counts carry it to forests without cameras. The report's minimum estimate was 3,167 tigers. The National Tiger Conservation Authority puts India's estimated total at 3,682 tigers, nearly 70% of the world's wild tigers.
Worked example: from sign counts to a tiger estimate
The numbers here are made up to show the method. They are not real survey data.
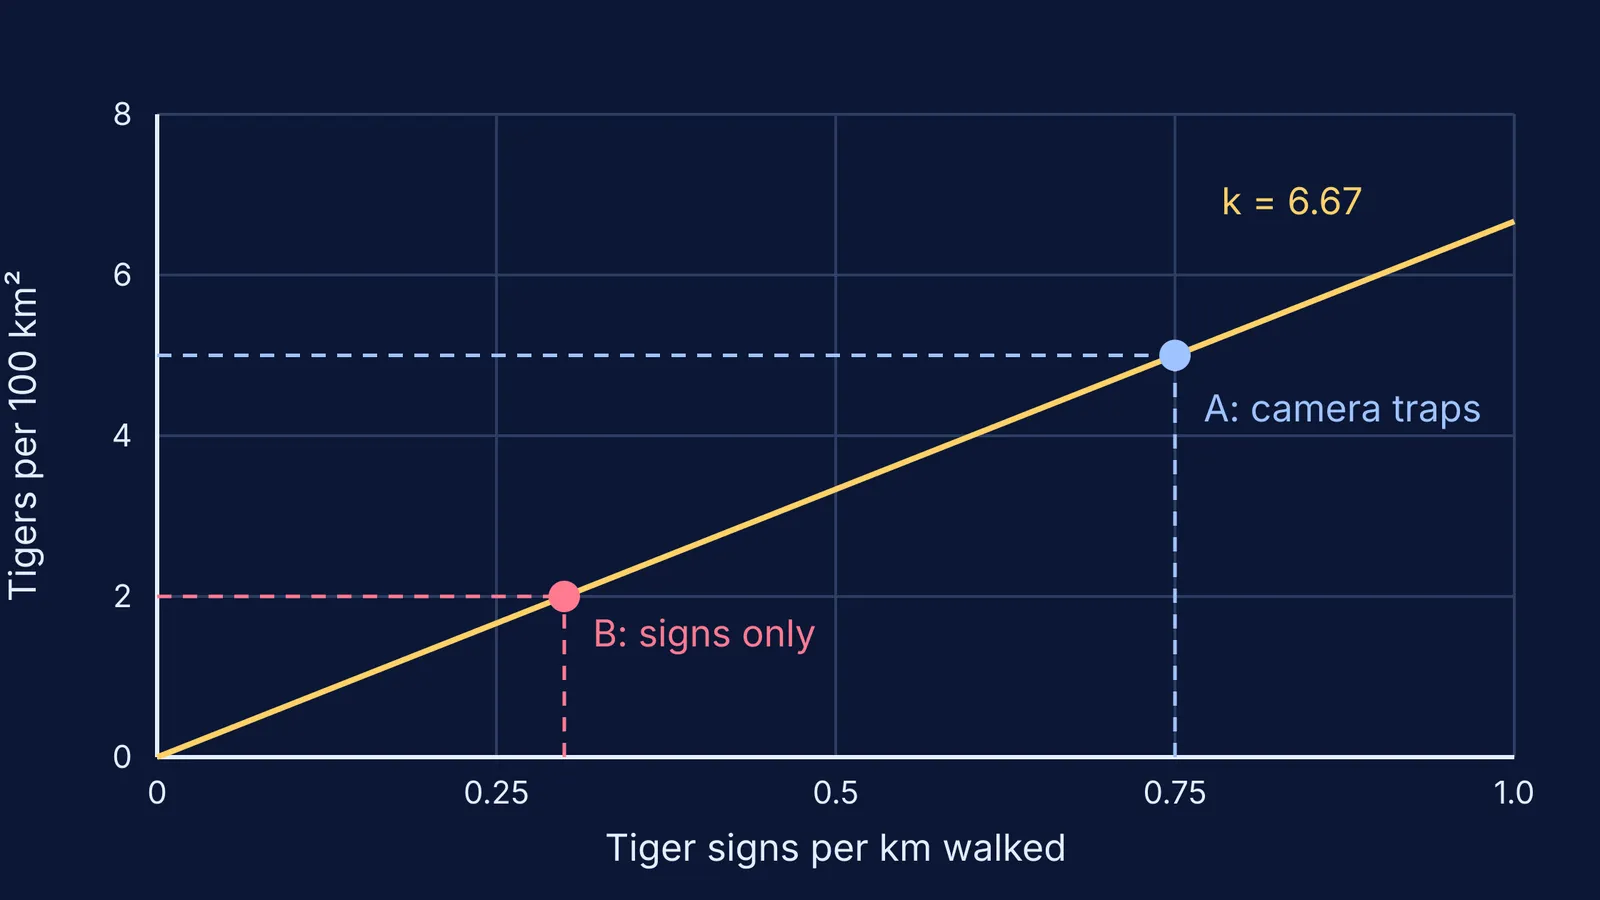
Reserve A has camera traps. They show 5 tigers per 100 km². Walkers there covered 40 km and found 30 tiger signs, so 30 / 40 = 0.75 signs per km.
Calibrate: k = 5 / 0.75 = 6.67 tigers per 100 km² for every 1 sign per km.
Forest B has no cameras. Walkers covered 50 km and found 15 signs, so 0.30 signs per km. Its relative density is 0.30 / 0.75 = 0.4 of Reserve A's.
Convert: 0.30 × 6.67 = 2.0 tigers per 100 km².
Scale up: Forest B covers 600 km², so 2.0 × 6 = 12 tigers.
Check that it makes sense: B has 40% of A's sign rate and comes out at 40% of A's density. The hidden assumptions: signs rise in step with tigers, are equally easy to spot in both forests, and one calibration site is enough. The real survey uses many camera-trapped sites plus habitat data.
How can you practise this kind of estimate?
The same logic of sampling a part and scaling up runs through the quadrat method for plant population density and mark and recapture with virtual fish. Try redoing the worked example with Forest B at 0.45 signs per km. You should get 3.0 tigers per 100 km² and 18 tigers.
If you want more problems where you build an estimate one step at a time, the Fermi Problem Library has worked problems with a step-by-step solver that explains the reasoning rather than printing an answer. For terms like population density, natality and carrying capacity, the Fermi Concept Library gives each concept its own lesson.