On this page
How many tigers live in a forest? You cannot see most of them, they move over large areas, and each one avoids people. For many years the answer came from counting tracks, or pugmarks, which turned out to be unreliable. The Indian zoologist who changed this was K. Ullas Karanth. Here is the problem he solved, the maths behind his method with a worked example, the mistakes to avoid, and what a student can take from how he worked.
Who is Ullas Karanth?
Karanth is an Indian zoologist who has spent more than 30 years studying tigers, according to the Centre for Wildlife Studies, the research group he is associated with. His longest-running study site, as the papers below show, was Nagarahole in Karnataka. His core idea fits in one sentence: treat each photograph of a tiger like a "capture" of a marked animal, because every tiger's stripes are unique.
Why were older tiger counts unreliable?
In their 1998 paper Estimation of tiger densities in India using photographic captures and recaptures, Karanth and his co-author James Nichols wrote that methods based on total counts of tracks "have proved unreliable". Without good numbers, they argued, it was hard both to understand tiger ecology and to protect tigers.
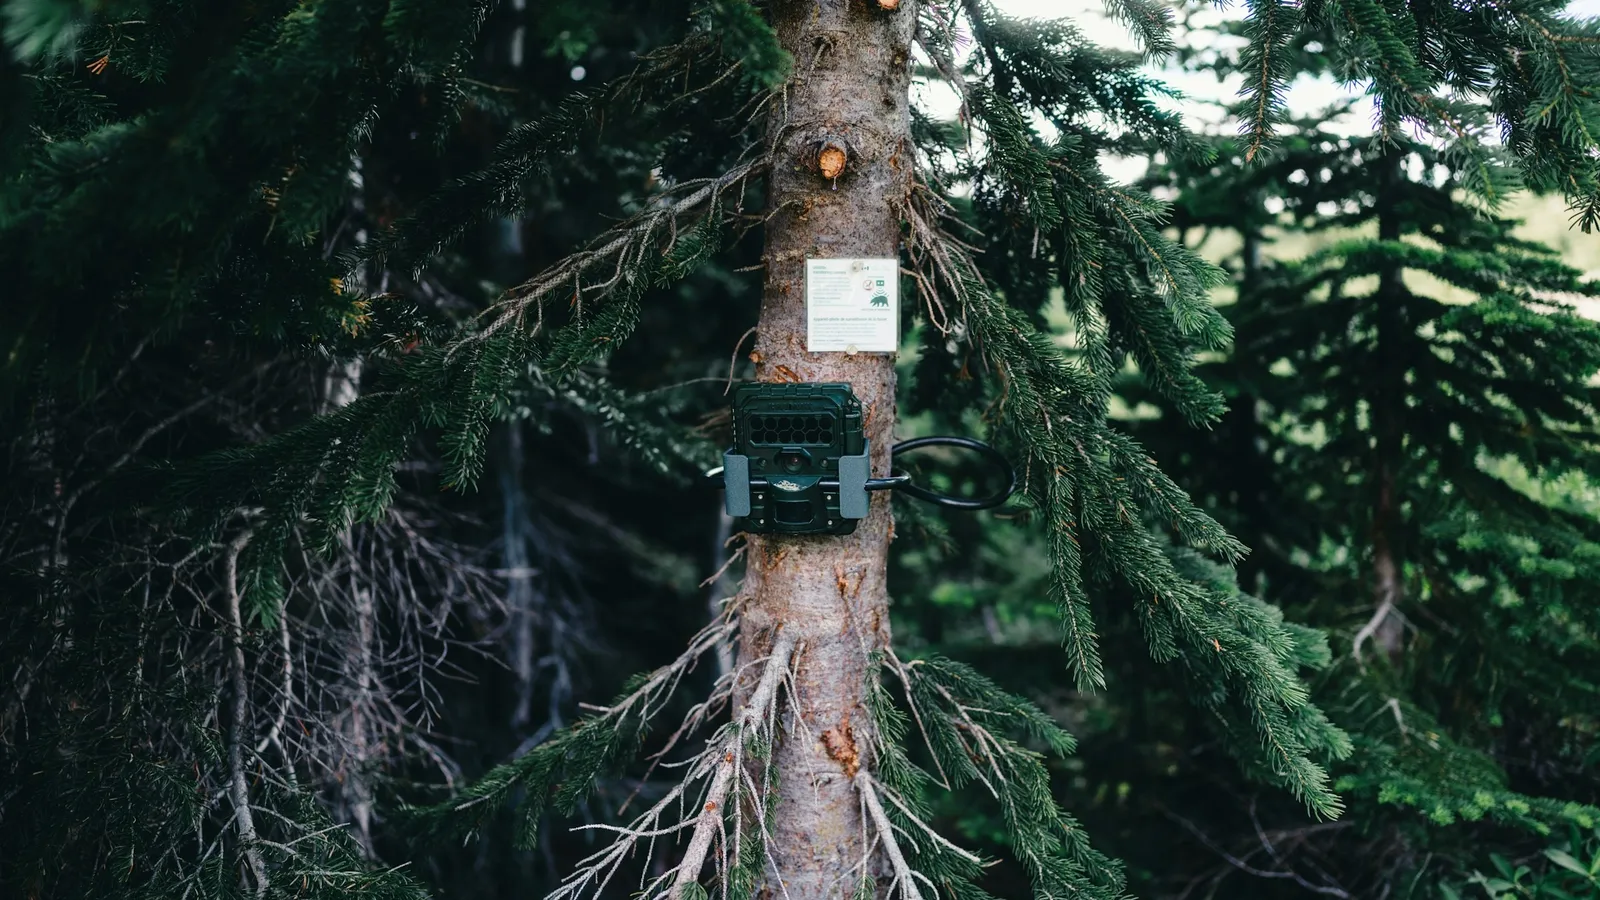
Their paper describes the field method Karanth first proposed in Biological Conservation in 1995: photograph tigers with camera traps, identify individuals from their natural markings, and analyse who was photographed when using capture-recapture models.
How does capture-recapture work?
The simplest version is the Lincoln-Petersen estimate. Suppose a closed population of N animals. In the first session you "mark" M of them. In the second session you catch C animals, of which R were already marked. If every animal is equally likely to be caught, the marked fraction in the second sample should match the marked fraction in the whole population:
R / C ≈ M / N, so N ≈ M × C / R.
With camera traps, "marking" costs the tiger nothing. Its stripes are its tag.
Worked example with sample numbers
These are made-up numbers for practice, not data from a real reserve.
Session 1. Cameras photograph 12 different tigers. So M = 12.
Session 2. Cameras photograph 15 different tigers. Comparing stripes, 9 of them are among the first 12. So C = 15 and R = 9.
Estimate. N ≈ 12 × 15 / 9 = 180 / 9 = 20 tigers.
Density. If the area the population effectively uses is 250 km², density = 20 / 250 = 0.08 tigers per km², or 8 tigers per 100 km².
Notice that only 18 different tigers were ever photographed (12 + 15 − 9 = 18), yet the estimate is 20. The method accounts for animals the cameras missed.
What did the real studies find?
Karanth and Nichols applied the method at four sites in India. The chance that a tiger present at a site was photographed ranged from 0.75 to 1.00. Estimated densities of tigers older than one year ranged from 4.1 to 16.8 tigers per 100 km². At the same sites, prey densities of 56.1 to 63.8 hoofed animals per km² were measured, and tiger density generally rose with prey density, except at one site affected by poaching.
A later study, Karanth and colleagues (2006), followed the Nagarahole population for nine years. They photographed 74 individual tigers over 5,725 trap-nights. Annual survival was about 0.77, the population ranged from about 17 to 31 tigers, and it grew about 3% a year on average, despite heavy annual losses.
How does India count tigers now?
The national survey uses the same principle on a far larger scale. The Status of Tigers 2022 summary report from the National Tiger Conservation Authority describes camera traps at 32,588 locations across 174 sites, producing 4,70,81,881 photographs, of which 97,399 were of tigers. It reports 3,080 unique tigers photographed in 2022, up from 2,461 in 2018, and a minimum population estimate of 3,167. Abundance was estimated with spatially explicit capture-recapture, which also uses where each tiger was photographed. The report notes that the Western Ghats population showed a decline even though major populations there were stable.
What mistakes do students make with these estimates?
Counting photographs, not individuals. One tiger photographed 40 times is still one marked animal.
Treating the photographed count as the total. The estimate is usually higher, because some animals are never photographed.
Forgetting the area. Density needs the area the population uses, not just the area inside the camera grid.
Ignoring assumptions. If tigers learn to avoid cameras, R falls and N is overestimated.
Population attributes are part of the ecology unit in NEET; our post on biodiversity and conservation for NEET covers related ideas. For another wildlife scientist who counted carefully, read about M. Krishnan.
If the probability step feels shaky, the Fermi Concept Library covers every concept in mathematics and biology with its own lesson.
What can a student take from how Karanth worked?
Question the standard method. Track counts were accepted for years. He asked how reliable they were, and built a method whose errors could be measured.
Borrow tools from other fields. Capture-recapture came from statistics. He paired it with a camera.
Report uncertainty. His papers give each estimate with a standard error, not just a single number.
Next step: redo the worked example if 6, not 9, of the second-session tigers had been seen before, and explain why the estimate changes so much.