
On this page
"Indian Economy 1950–1990" is Chapter 2 of NCERT's Indian Economic Development, and the copy on the NCERT site is marked Reprint 2026-27 (NCERT keec102). Every figure below comes from that text.
Is this chapter in the CBSE 2026-27 Economics syllabus?
Yes. The CBSE Economics curriculum for 2026-27 prints 12 marks against "Development Experience (1947-90) and Economic Reforms since 1991". Its Unit 6 content names what this chapter teaches: the Indian economic system and common goals of Five Year Plans; agriculture (institutional aspects and new agricultural strategy); industry (IPR 1956; SSI, role and importance); and foreign trade.
The 2026-27 sample paper tests the chapter with one-mark questions on the architect of Indian planning and on what held back land ceiling laws. The marking scheme answers them with Prasanta Chandra Mahalanobis, and with court challenges, loopholes and land registered in relatives' names.
What were the goals of India's five year plans?
India chose a mixed economy. In 1950 the government created the Planning Commission, chaired by the Prime Minister (NCERT keec102). NCERT calls Mahalanobis the architect of Indian planning.
The four goals:
Growth: a steady rise in GDP, so the economy can turn out more goods and services.
Modernisation: new technology, and a changed social outlook, such as using women's talents at work.
Self-reliance: avoiding imports of goods India could make itself, especially food.
Equity: making sure the gains reach the poor, so every Indian can meet basic needs.
Goals can clash: a new machine can cut the need for labour, so modernisation can work against employment.
What changed in agriculture between 1950 and 1990?
Land reforms came first. Abolishing intermediaries such as zamindars left some 200 lakh tenants dealing with the government directly, and land ceilings capped how much land one person could own (NCERT keec102). Land reforms succeeded in Kerala and West Bengal.
The green revolution followed: high yielding variety (HYV) seeds for wheat and rice, needing fertiliser, pesticide and water. In the first phase (about the mid-1960s to the mid-1970s), HYV seeds stayed mostly in richer states, namely Punjab, Andhra Pradesh and Tamil Nadu; in the second (mid-1970s to mid-1980s), they spread to more states and crops. By the late 1960s India was self-sufficient in food grains.
Farmers sold a large marketed surplus, so food grain prices fell relative to other goods, helping low-income families. Learn both sides of the subsidy debate: subsidies got small farmers to try a risky technology, but critics say they also help the fertiliser industry and richer regions.
How did industry and trade policy work from 1950 to 1990?
The Industrial Policy Resolution 1956 sorted industries into three groups: those owned only by the state; those where private firms could supplement the public sector, with the state starting new units; and the rest, left to private firms but controlled through licences (NCERT keec102). In 1955 the Karve Committee saw small-scale industry as a route to rural development; in 1950 a small-scale unit could invest at most ₹5 lakh.
Trade followed import substitution: tariffs and quotas shielded Indian firms from foreign competition, and exports got no serious push until the mid-1980s.
Industry's share of GDP rose from 13 per cent in 1950-51 to 24.6 per cent in 1990-91, and the sector grew about six per cent a year. The costs: loss-making public firms kept running, big houses used licences to block rivals under the permit licence raj, and protected producers had little reason to improve quality. These pressures led to the 1991 reforms, covered in our guide to the LPG reforms of 1991.
How do you write a fair appraisal answer?
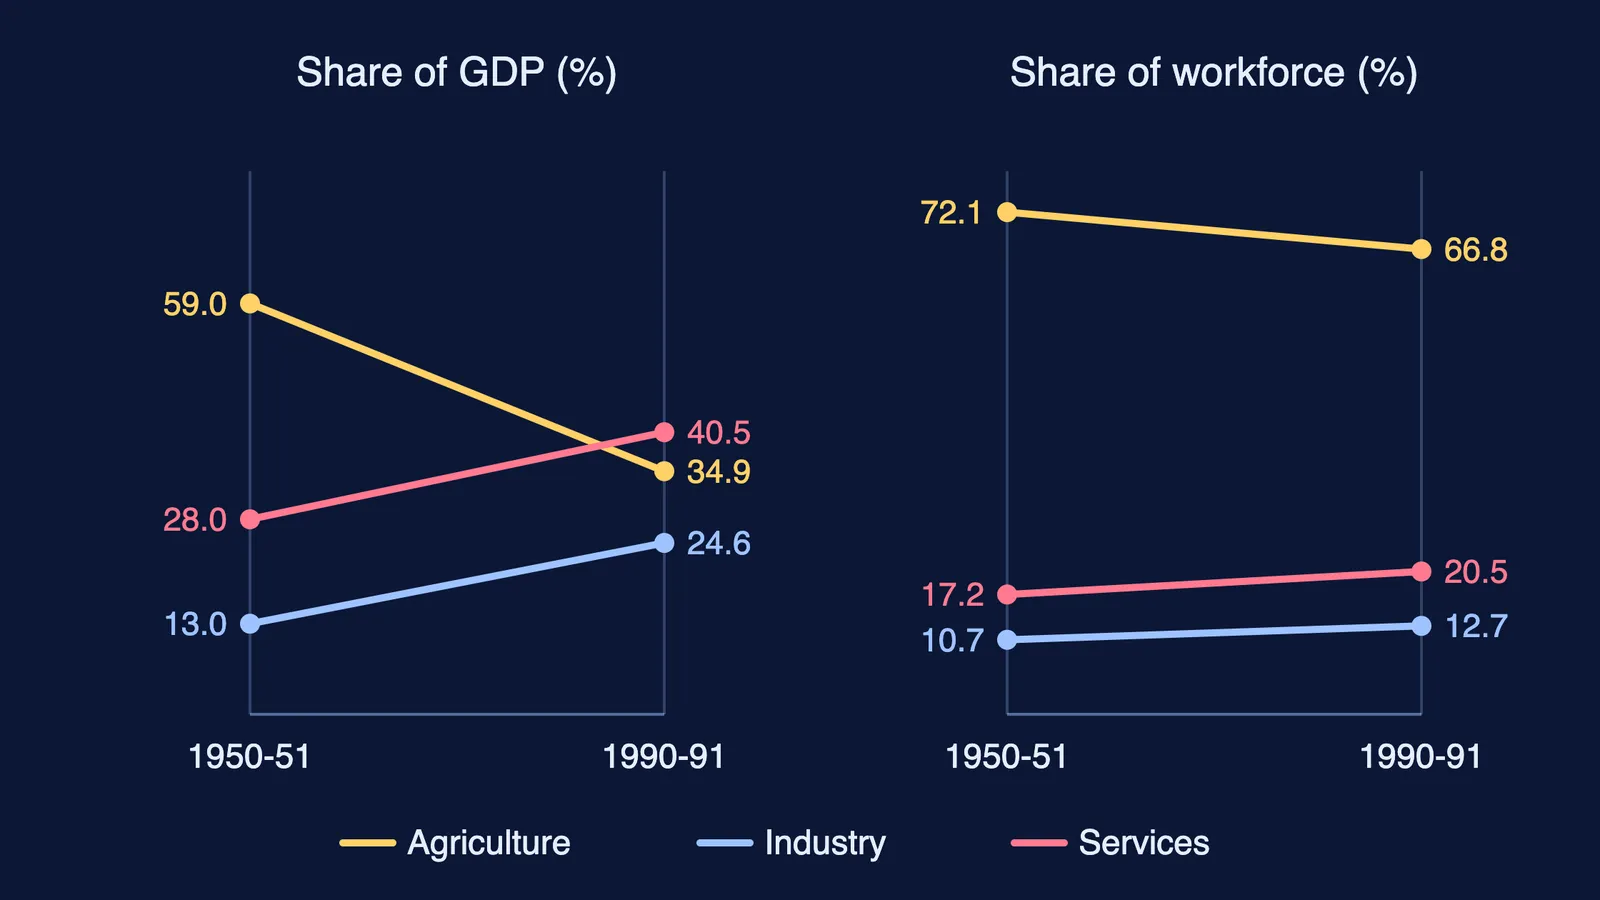
Key example: use NCERT's two tables together. Agriculture's share of GDP fell from 59.0 per cent in 1950-51 to 34.9 per cent in 1990-91, but its share of the workforce only slipped from 72.1 to 66.8 per cent (NCERT keec102). The chart above plots both.
Practice question (4 marks, our own): "Agriculture's share of India's GDP fell sharply between 1950 and 1990. Did planning move people out of farming at the same pace? Give reasons."
State the fact with both pairs of numbers: GDP share 59.0 to 34.9 per cent; workforce share 72.1 to 66.8 per cent.
Interpret: output moved out of farming far faster than people did.
Explain: industry and services did not take in the workers leaving farms; NCERT notes that many economists see this as a major policy failure of the period.
Balance: the green revolution still made India self-sufficient in food grains.
NCERT's running text uses a slightly different measure, the population depending on agriculture, which went from 67.5 per cent in 1950 to 64.9 per cent by 1990. Quote one set and say what it measures.
Next, read our guides to human capital formation in India and rural credit, marketing and organic farming. If Economics shares your timetable with Maths, the Fermi Problem Library has worked problems with a step-by-step solver that explains the reasoning rather than printing an answer.