
On this page
India, China and Pakistan close the Indian Economic Development half of CBSE Class 12 Economics. The chapter turns on a few tables, and marks go to students who quote them correctly and explain them. Here are the syllabus position, the three paths, the figures with their years, and a method for comparison answers.
Is this chapter in the CBSE Class 12 Economics syllabus for 2026-27?
Yes. The CBSE Economics curriculum for 2026-27 lists Unit 8, "Development Experience of India: A comparison with neighbours", covering India and Pakistan, India and China, and the issues of economic growth, population, sectoral development and other human development indicators. Its marks table gives "Development Experience of India – A Comparison with Neighbours" 08 marks in the 80-mark theory paper.
The chapter is Chapter 8 of NCERT's Indian Economic Development, and the current PDF is marked Reprint 2026-27. Its title page says Class XI, but CBSE prescribes it for Class 12.
How did India, China and Pakistan's development paths differ?
All three started at about the same time, according to NCERT Chapter 8. Learn this order:
1947: India and Pakistan become independent; the People's Republic of China follows in 1949.
First plans: India 1951–56, China 1953, Pakistan 1956.
China, 1958: the Great Leap Forward; that year 26,000 communes took in nearly all of China's farmers.
China, 1966–76: the Great Proletarian Cultural Revolution.
Pakistan, 1970s: the state took over capital goods industries, then turned to denationalisation from the late 1970s.
Reforms: China 1978, Pakistan 1988, India 1991.
The key difference is why reforms began. NCERT says China faced no outside pressure to reform, whereas India and Pakistan reformed on terms set by the World Bank and IMF. China's came in phases: farm plots for households, township and village enterprises, dual pricing and special economic zones. For India's side of the story, see our guide to the 1991 LPG reforms.
What do the NCERT tables show for India, China and Pakistan?
Always give the year of the table you quote. These figures are from the Reprint 2026-27 edition of NCERT Chapter 8.
Demography (Table 8.1, 2021–23): population India 1,428 million, China 1,411 million, Pakistan 240 million; fertility rate 2.0, 1.2 and 3.4; sex ratio 930, 898 and 948; urbanisation 36, 65 and 38 per cent.
Growth (Table 8.2): GDP growth in 1980–90 was 5.7 per cent for India, 10.3 for China and 6.3 for Pakistan; in 2024 it was 6.5, 5.0 and 3.1.
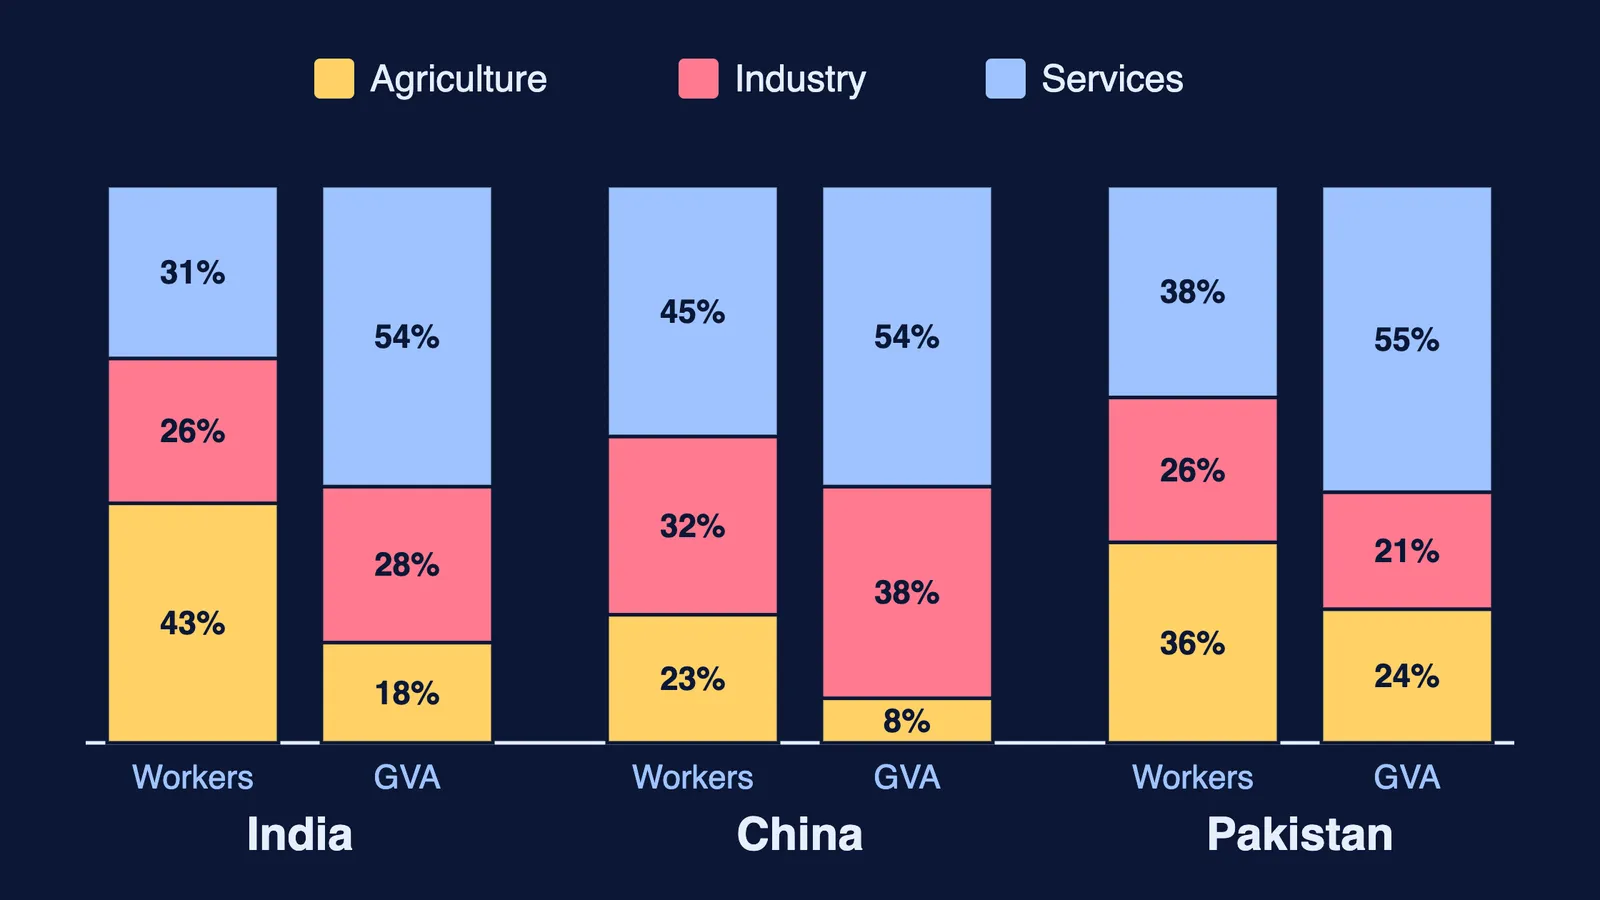
Sectors (Table 8.3, 2022): agriculture employs 43 per cent of India's workforce but gives 18 per cent of GVA; in China the figures are 23 and 8, in Pakistan 36 and 24.
Human development (Table 8.5, 2017-2023): HDI value India 0.685, China 0.797, Pakistan 0.544; infant mortality 25.5, 4.8 and 51 per 1,000 live births; maternal mortality 103, 23 and 154 per lakh births.
China followed the classical shift from agriculture to industry to services, while India and Pakistan moved directly from agriculture to services. If human development terms feel shaky, revise human capital formation in India alongside this table.
Question 33 A of the CBSE 2026-27 sample paper prints its own data table.
Another trap: Table 8.5 prints 21.9 per cent below the national poverty line for both India (2019-21) and Pakistan (2023), yet the chapter text says Pakistan has done better than India on poverty. Quote the figures and their years rather than calling one country lower.
How do you answer a comparison question in the board exam?
In the 2026-27 marking scheme, the 3-mark comparison of two human development indicators gives 1½ marks to each indicator, and each model point compares India with China using both figures. Use four steps:
Name the indicator and its unit.
Quote each country's figure from the table, with the year.
Say who is ahead and by how much.
Give one reason from the chapter.
Practice question (original, 4 marks): Using the 2022 sectoral data, show which country followed the classical path of structural change, and which did not.
Model answer:
China followed it. Only 23 per cent of its workers remain in agriculture, and industry gives 38 per cent of GVA, the highest of the three (NCERT Table 8.3).
India did not. Agriculture still employs 43 per cent of workers but gives 18 per cent of GVA, and services give 54 per cent of GVA while industry gives 28 per cent.
Nor did Pakistan: industry gives 21 per cent of GVA, services 55 per cent.
So India and Pakistan moved from agriculture straight to services.
Remember: in India, 43 per cent of workers produce 18 per cent of GVA. If reading percentages quickly is the weak spot, the Fermi Concept Library has every concept in physics, chemistry, biology, mathematics and computing, each with its own lesson and its place in the map.
What else should you revise?
Learn NCERT's point that human development indicators are incomplete without liberty indicators, such as constitutional protection of citizens' rights. Then link it to an earlier chapter, environment and sustainable development.