On this page
A Freundlich graph question is really a straight-line question. Once you see the log form as y = c + mx, finding 1/n and k takes a few lines of working.
What does the Freundlich log(x/m) vs log p graph show?
The Freundlich isotherm links how much gas a solid holds to the gas pressure at a fixed temperature: x/m = k p^(1/n), where x is the mass adsorbed and m is the mass of the adsorbent. The NPTEL course notes on surface chemistry call it "an empirical relation" and, for a solute in solution with concentration in place of pressure, say its constants come from the intercept and slope of a log plot (NPTEL, Module 8, Lecture 36). It is named after Herbert Freundlich, author of "Über die Adsorption in Lösungen" in Zeitschrift für Physikalische Chemie (Crossref record); our post on who Freundlich was and what his isotherm says covers the history.
Take log base 10 of both sides:
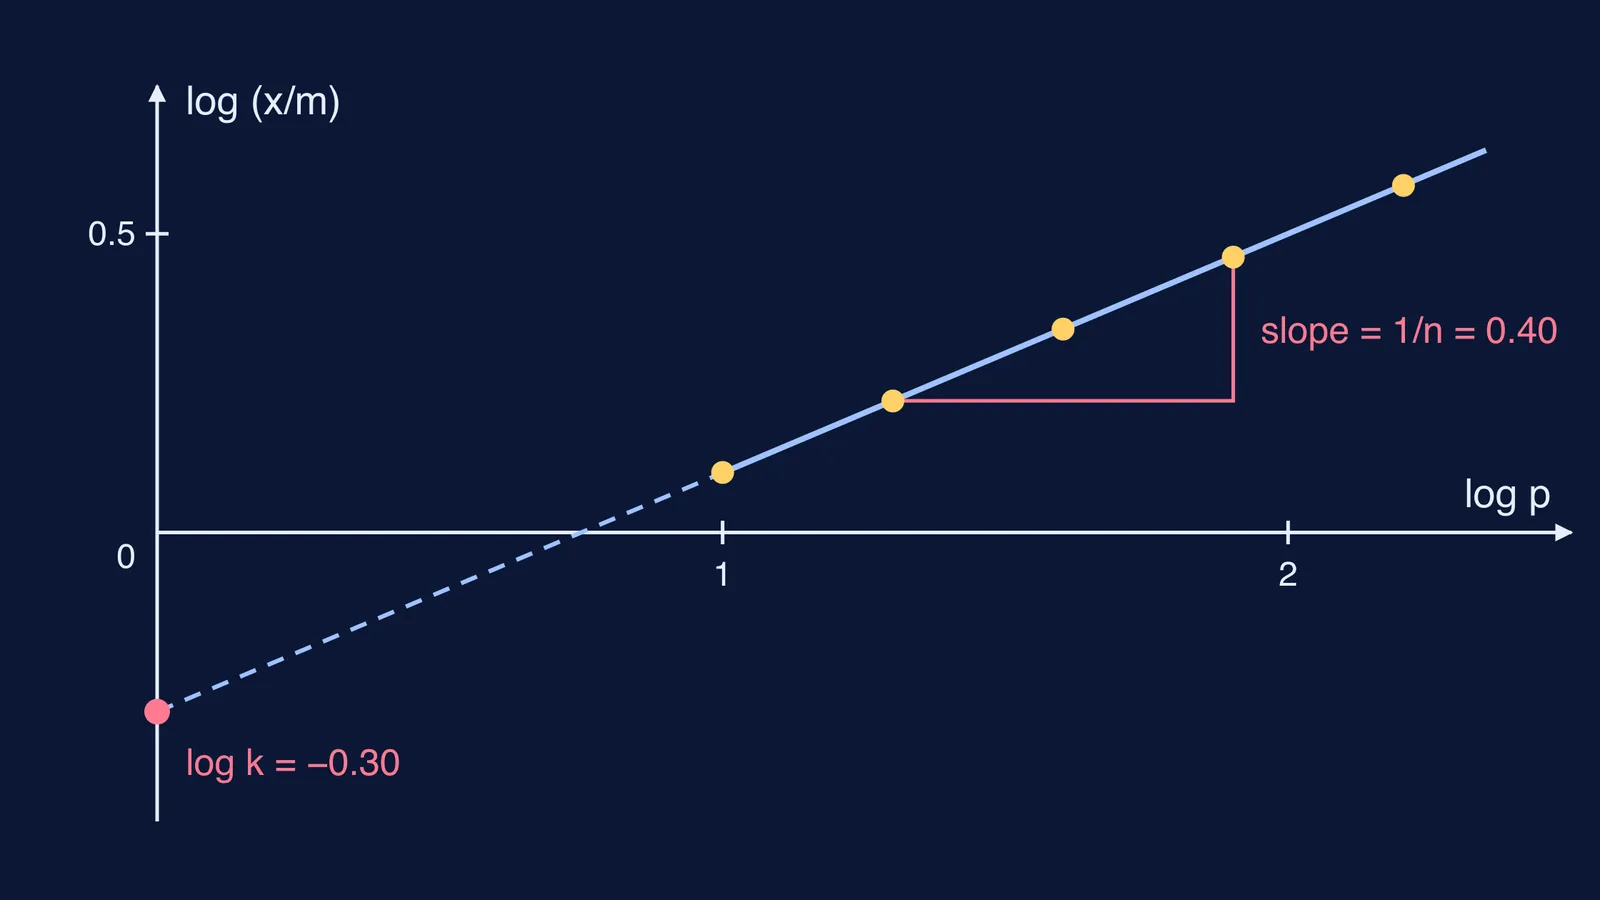
log(x/m) = log k + (1/n) log p
Now match it with y = c + mx:
y = log(x/m), on the vertical axis
x = log p, on the horizontal axis
slope m = 1/n
intercept c = log k, the value of log(x/m) where log p = 0, which means p = 1 in your pressure unit
A straight line means the Freundlich equation fits; a curve means it does not. The same trick turns any power law into a line, as our guide to finding the exponent in lab data with log-log graphs shows.
How do you find 1/n and k from the graph?
Here is an illustrative data set for a gas on activated charcoal at one temperature, with x/m in mg per g and p in kPa.
p = 10, x/m = 1.26, so log p = 1.000 and log(x/m) = 0.100
p = 20, x/m = 1.66, so log p = 1.301 and log(x/m) = 0.220
p = 40, x/m = 2.19, so log p = 1.602 and log(x/m) = 0.340
p = 80, x/m = 2.89, so log p = 1.903 and log(x/m) = 0.461
p = 160, x/m = 3.81, so log p = 2.204 and log(x/m) = 0.581
Step 1: plot and check. Log p goes on the x-axis, log(x/m) on the y-axis. The five points lie on one straight line, so the Freundlich form holds.
Step 2: slope. Take two points far apart on the line. Using the first and last: slope = (0.581 − 0.100) ÷ (2.204 − 1.000) = 0.481 ÷ 1.204 = 0.40. So 1/n = 0.40 and n = 2.5.
Step 3: intercept. The data start at log p = 1, so either extend the line back to log p = 0 or use any point on it: log k = log(x/m) − (1/n) log p = 0.100 − 0.40 × 1.000 = −0.30. So k = 10^(−0.30) ≈ 0.50.
Step 4: check. For the middle point, the line predicts −0.30 + 0.40 × 1.602 = 0.341, against 0.340 measured.
Why is 1/n usually between 0 and 1?
The NPTEL notes reason that adsorption is nearly proportional to concentration at low values and nearly constant at high values, so in between it is reasonable for x/m to vary as a power lying between 0 and 1 (NPTEL, Lecture 36). With an exponent of exactly 1, the Freundlich isotherm reduces to a linear isotherm, as the USGS VS2DTI model notes state.
Our 0.40 sits in between: doubling p multiplies x/m by 2^0.40 ≈ 1.32, and 1.66 ÷ 1.26 = 1.32 agrees. Each line holds for one temperature only; for why heating affects the two kinds of adsorption differently, see our post on physisorption vs chemisorption and temperature.
Which mistakes cost marks on this graph?
Swapping the axes. With log p on the y-axis, the slope becomes n, not 1/n.
Reading the intercept at the edge of the graph paper. If your x-axis starts at 1, the left edge is not log p = 0.
Mixing ln and log. With ln on both axes the slope is still 1/n, but the intercept is ln k, so k = e^(intercept).
Ignoring the pressure unit. Switching from kPa to bar (1 bar = 100 kPa) leaves the slope at 0.40 but changes k: here k becomes 0.50 × 100^0.40 ≈ 3.2 when p is in bar.
If you get the slope right but keep slipping on the intercept, work through more problems in the Fermi Problem Library, whose step-by-step solver explains the reasoning rather than printing an answer. If logarithms feel shaky, the Fermi Concept Library has a lesson for each concept in mathematics and chemistry.
Next time, write y = c + mx under the equation before you touch the numbers.