

On this page
Charcoal soaks up gases. Herbert Freundlich wrote down a simple rule for how much it takes up as the pressure rises: x/m = kp^(1/n). Here is who he was, what the equation says, and how to pull k and n out of the data in his book.
Who proposed the Freundlich adsorption isotherm?
Herbert Freundlich was a German chemist, born in Charlottenburg in 1880, who wrote his habilitation thesis in Leipzig under Wilhelm Ostwald (biography). He headed a department at the Kaiser Wilhelm Institute for Physical Chemistry and Electrochemistry from 1919 until 1933, when Nazi racial policies forced him out. He then worked at University College London and the University of Minnesota, and died in Minneapolis in 1941.
His groundwork was a long 1907 paper, "Über die Adsorption in Lösungen" (On adsorption in solutions), pages 385 to 470 of the Zeitschrift für Physikalische Chemie (DOI record). Its Crossref record counts more than 3,500 works that cite it.
Two years later he published a book on colloid and surface chemistry, Kapillarchemie (1909), and applied the same equation to gases on solids.
What does x/m = kp^(1/n) actually mean?
In the Freundlich isotherm, x is the amount of gas adsorbed, m is the mass of the solid (the adsorbent), p is the gas pressure at equilibrium, and k and n are constants for a given gas, solid and temperature (Freundlich equation).
In Kapillarchemie, Freundlich notes that Scheele and Fontana both saw charcoal take up gas in 1777. Fontana heated charcoal to drive off gas, cooled it under mercury and slid it into a trapped volume of gas; the mercury rose as the charcoal swallowed the gas (Kapillarchemie, 1909).
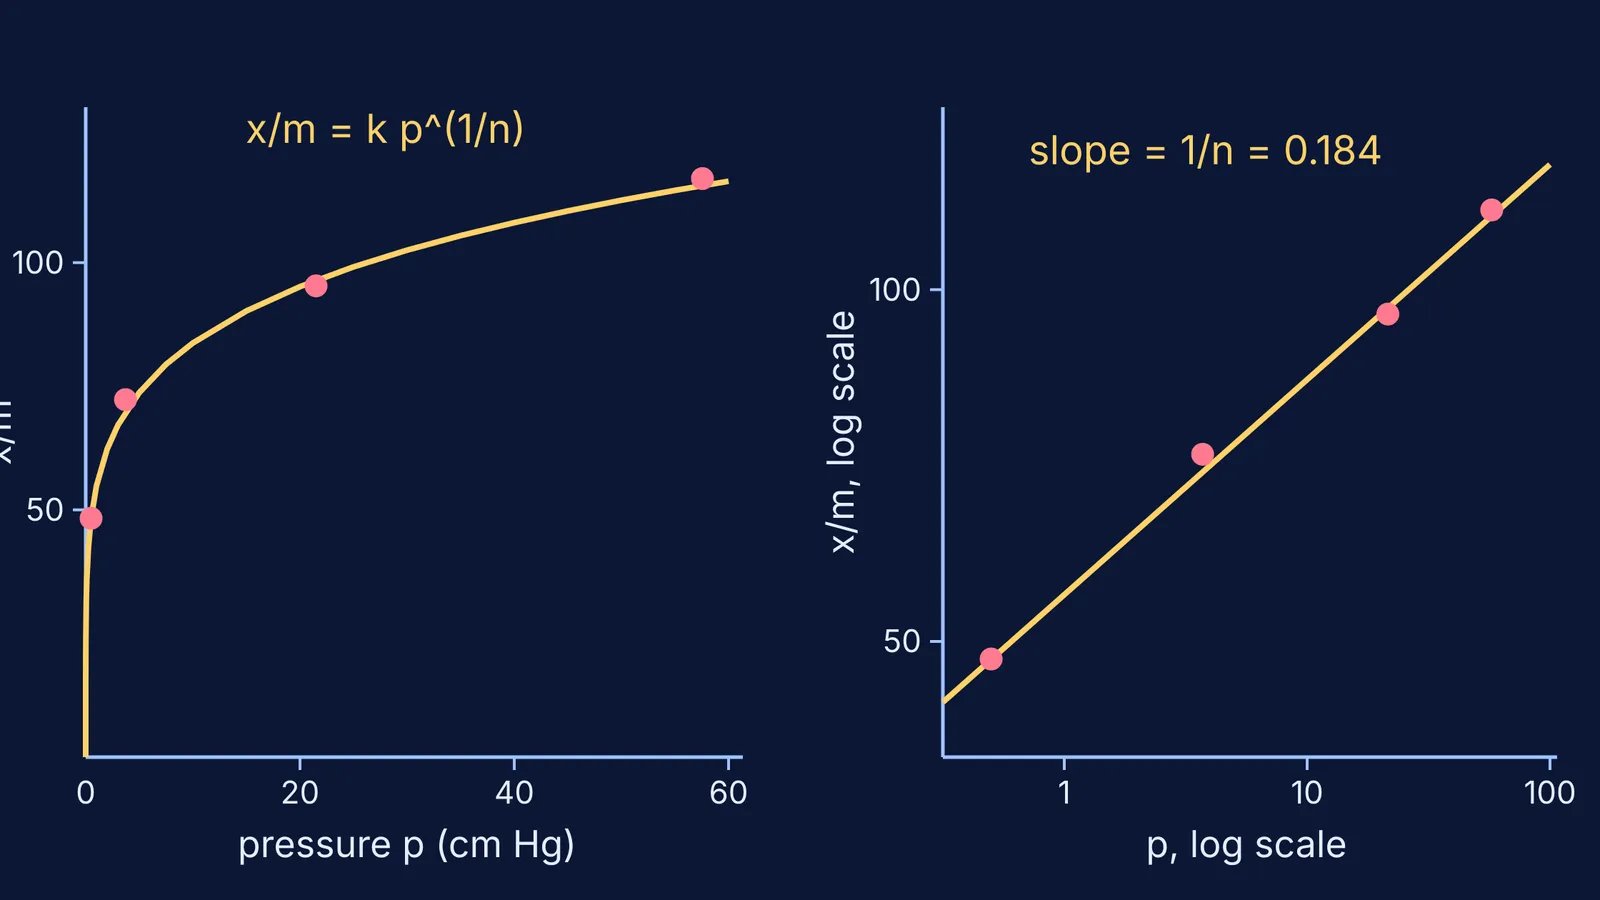
Freundlich then plotted Chappuis's measurements of carbon dioxide and ammonia on charcoal at 0 °C, as the volume of gas taken up by 1 g of charcoal against pressure. On a graph of log(x/m) against log p, the points fell on lines he called practically straight ("praktisch gerade"), though he noted that a concave bend was often unmistakable. Because the rule holds at one fixed temperature, he called it an adsorption isotherm ("Adsorptionsisotherme").
Taking logs gives the form you will use most: log(x/m) = log k + (1/n) log p. This is a straight line with slope 1/n and intercept log k (Freundlich equation).
How do you find k and 1/n from data?
Freundlich's book gives a table, based on Chappuis's measurements, for ammonia adsorbed on meerschaum at 0 °C, with p in centimetres of mercury (Kapillarchemie, 1909, Table 19):
p = 0.500, x/m = 48.3
p = 3.713, x/m = 72.3
p = 21.50, x/m = 95.3
p = 57.56, x/m = 117
Work it out with only the first and last rows:
Slope: 1/n = log(117 / 48.3) / log(57.56 / 0.500) = 0.3842 / 2.0612 = 0.1864.
Intercept: log k = log 48.3 − 0.1864 × log 0.500 = 1.6839 + 0.0561 = 1.7400, so k ≈ 55.0.
Test it on a row you did not use: at p = 21.50, log(x/m) = 1.7400 + 0.1864 × 1.3324 = 1.9884, so x/m ≈ 97.4. The measured value was 95.3.
Compare with the source: Freundlich's own fit used a constant of 54.83 and 1/n = 0.184, which predicts 96.4 at that pressure.
Notice the shape. The pressure rose about 115 times, from 0.500 to 57.56, but the uptake rose only about 2.4 times. That flattening is the whole story of the curve.
If the log steps are where you slip, the Fermi Problem Library has worked problems with a step-by-step solver that explains the reasoning rather than printing an answer.
Where does the Freundlich isotherm stop working?
The equation is empirical: Freundlich fitted it to data rather than deriving it from a model of the surface. At high pressure, real adsorption reaches saturation and stops growing, while kp^(1/n) keeps rising, so the equation fails there (Freundlich equation).
A model built on a surface with a fixed number of sites, each holding one molecule, explains that ceiling. You can read how Irving Langmuir pictured the surface as a chessboard. For the colloids in the rest of his book, see John Tyndall and the light beam that reveals a colloid.
Is the Freundlich isotherm still in the Class 12 syllabus?
For CBSE, not in theory. The board's 2025-26 Class 12 chemistry curriculum lists ten theory units, and surface chemistry is not one of them; the practical list keeps only sols, dialysis and emulsions under that heading (CBSE Chemistry curriculum 2025-26). Syllabuses change, so check the current official one for your board or entrance exam before revising this.
To see why a curve flattens while its log plot stays straight, try the Fermi Simulation Lab, which has interactive simulations for ideas that are easier to see than to read.


