On this page
You have a pendulum timed at five lengths, or a table of planets, and you suspect one quantity depends on another raised to some power. Instead of guessing x², then x³, draw one graph that hands you the exponent.
Why does a log-log graph turn a power law into a straight line?
Take a power law, y = kx^n, and log both sides: log y = n log x + log k. That is y = mx + c with new labels. Plot log y against log x and the slope is n; the intercept is log k.
Power functions appear as straight lines on a log-log graph, with the exponent equal to the slope (Wikipedia: log-log plot; the same derivation is on Physics NEXUS at ComPADRE).
From two points, n = log(y₂/y₁) ÷ log(x₂/x₁). Any base works if both axes use it; base 10 suits a calculator.
How do you find the exponent from pendulum data?
OpenStax College Physics gives the period of a simple pendulum as T = 2π√(L/g) for swings smaller than about 15°, independent of the bob's mass. Theory predicts n = 0.5; here is how data alone finds it. These readings are computed from the formula with g = 9.8 m/s², rounded to 0.01 s like a stopwatch average:
L = 0.20 m, T = 0.90 s
L = 0.40 m, T = 1.27 s
L = 0.60 m, T = 1.55 s
L = 0.80 m, T = 1.80 s
L = 1.00 m, T = 2.01 s
Add columns log L and log T. First row: log 0.20 = −0.699, log 0.90 = −0.046. Last row: log 1.00 = 0, log 2.01 = 0.303.
Plot all five points and check they sit on a line.
Slope = (0.303 − (−0.046)) ÷ (0 − (−0.699)) = 0.349 ÷ 0.699 = 0.50. So T ∝ L^0.5.
At log L = 0, log T = 0.303, so k = 2.01. Since k = 2π/√g, g = (2π ÷ 2.01)² ≈ 9.8 m/s².
One graph gave both the exponent and the constant. You can even predict the exponent before measuring with our guide to checking physics answers with units and dimensions.
How does a log-log graph reveal Kepler's third law?
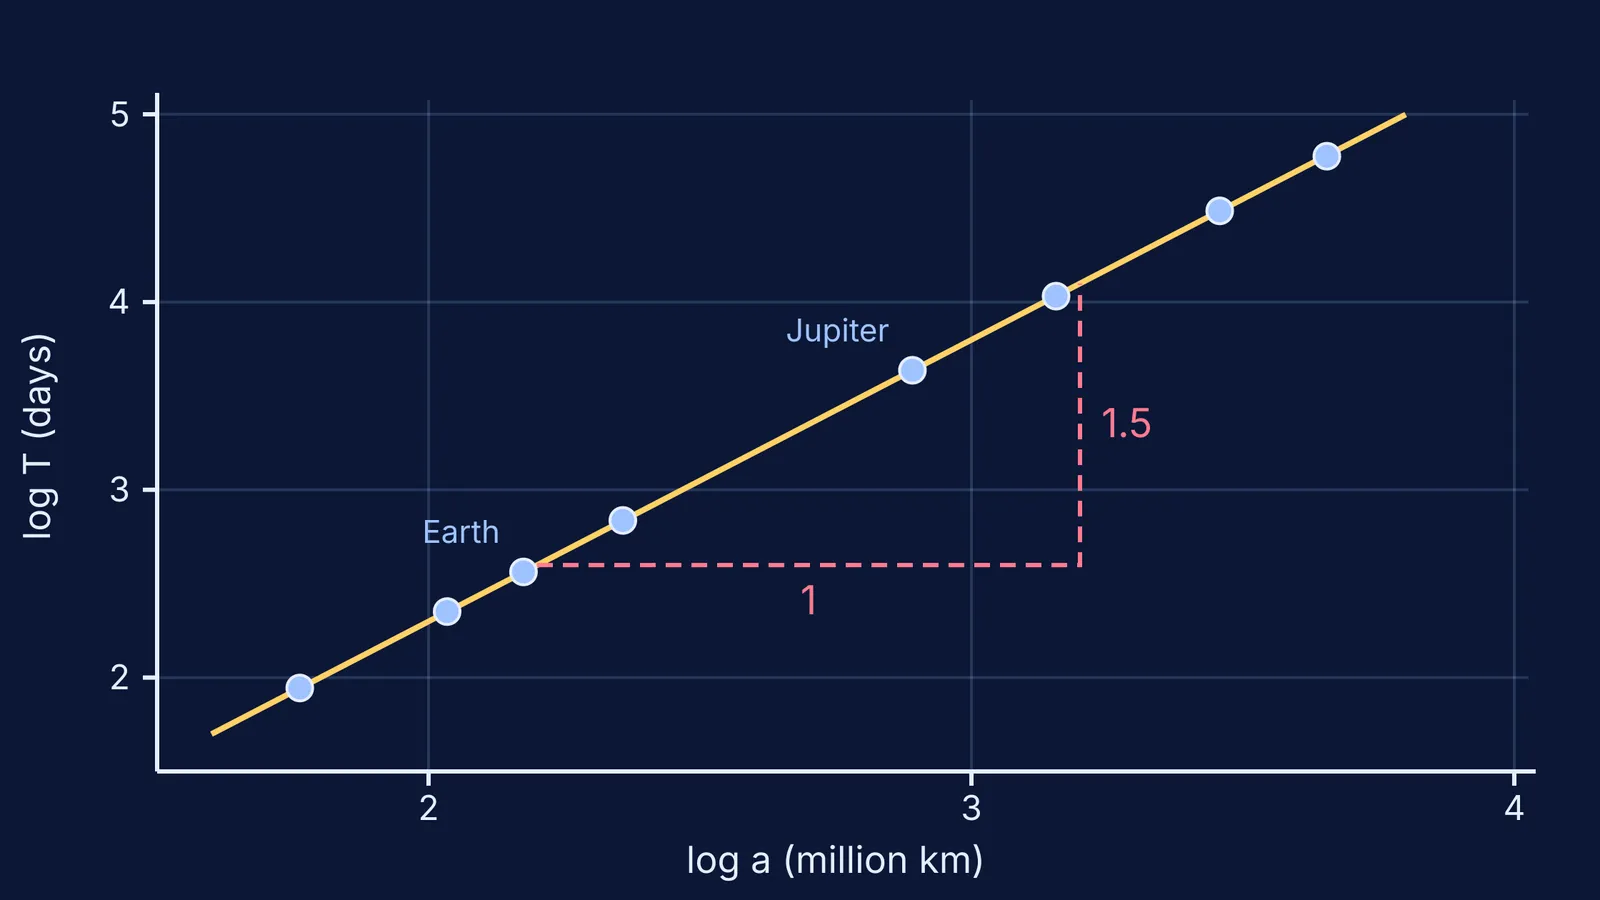
NASA's Planetary Fact Sheet lists Earth at 149.6 million km from the Sun with an orbital period of 365.2 days, and Jupiter at 778.5 million km with a period of 4,331 days. That distance is the semi-major axis, per NASA's notes page.
Earth: log 149.6 = 2.175, log 365.2 = 2.563
Jupiter: log 778.5 = 2.891, log 4331 = 3.637
Slope = (3.637 − 2.563) ÷ (2.891 − 2.175) = 1.074 ÷ 0.716 = 1.50
So T ∝ a^1.5; square both sides and T² ∝ a³. That is Kepler's third law as OpenStax University Physics states it: the square of the period is proportional to the cube of the semi-major axis. Mercury to Neptune from the same table also gives 2.832 ÷ 1.892 = 1.50. For why orbits behave this way, see our post on planetary orbits with a gravity simulation.
What if your log-log line is not straight?
A curve is information. Match the shape to a cause:
Bends at small x, straightens at large x. Probably an offset, such as measuring only the string and forgetting the bob's radius. Using the OpenStax formula with a 3 cm radius left out, the slope between string lengths of 5 and 10 cm is about 0.35, and between 40 and 80 cm about 0.47. Add the radius to every length and the line straightens at 0.5.
Fine except at one end. The physics may change there; the pendulum formula assumes swings under about 15°.
Curves steadily. Try log y against plain x: exponentials y = λa^(γx) are straight on a semi-log plot.
Straight, but no theory. Be careful: a roughly straight log-log line does not by itself prove a power law. Clauset, Shalizi and Newman showed why in Power-Law Distributions in Empirical Data (SIAM Review, 2009): of 24 real-world datasets thought to follow power-law distributions, some were consistent with one and others were ruled out.
To watch a relationship change before taking a reading, the Fermi Simulation Lab has interactive simulations for ideas that are easier to see than to read.
A checklist before you hand in the graph
Log both axes in the same base.
Spread x over as wide a range as you can.
Draw the best-fit line through all points, then read the slope from two far-apart points on that line, not from raw readings.
Compare the slope with simple fractions (0.5, 1.5, −2) and with theory.
If the line curves, name the reason: offset, change of regime, or wrong model.
If your slope keeps coming out wrong, the Fermi Problem Library has worked problems with a step-by-step solver that explains the reasoning rather than printing an answer.