On this page
Enzyme activity against temperature and enzyme activity against pH are both hills: activity climbs to a peak, then falls. Reading them takes three answers. Where is the peak? Why does each side slope down? Can the enzyme recover from what happened on that side?
What do the temperature and pH graphs of enzyme activity show?
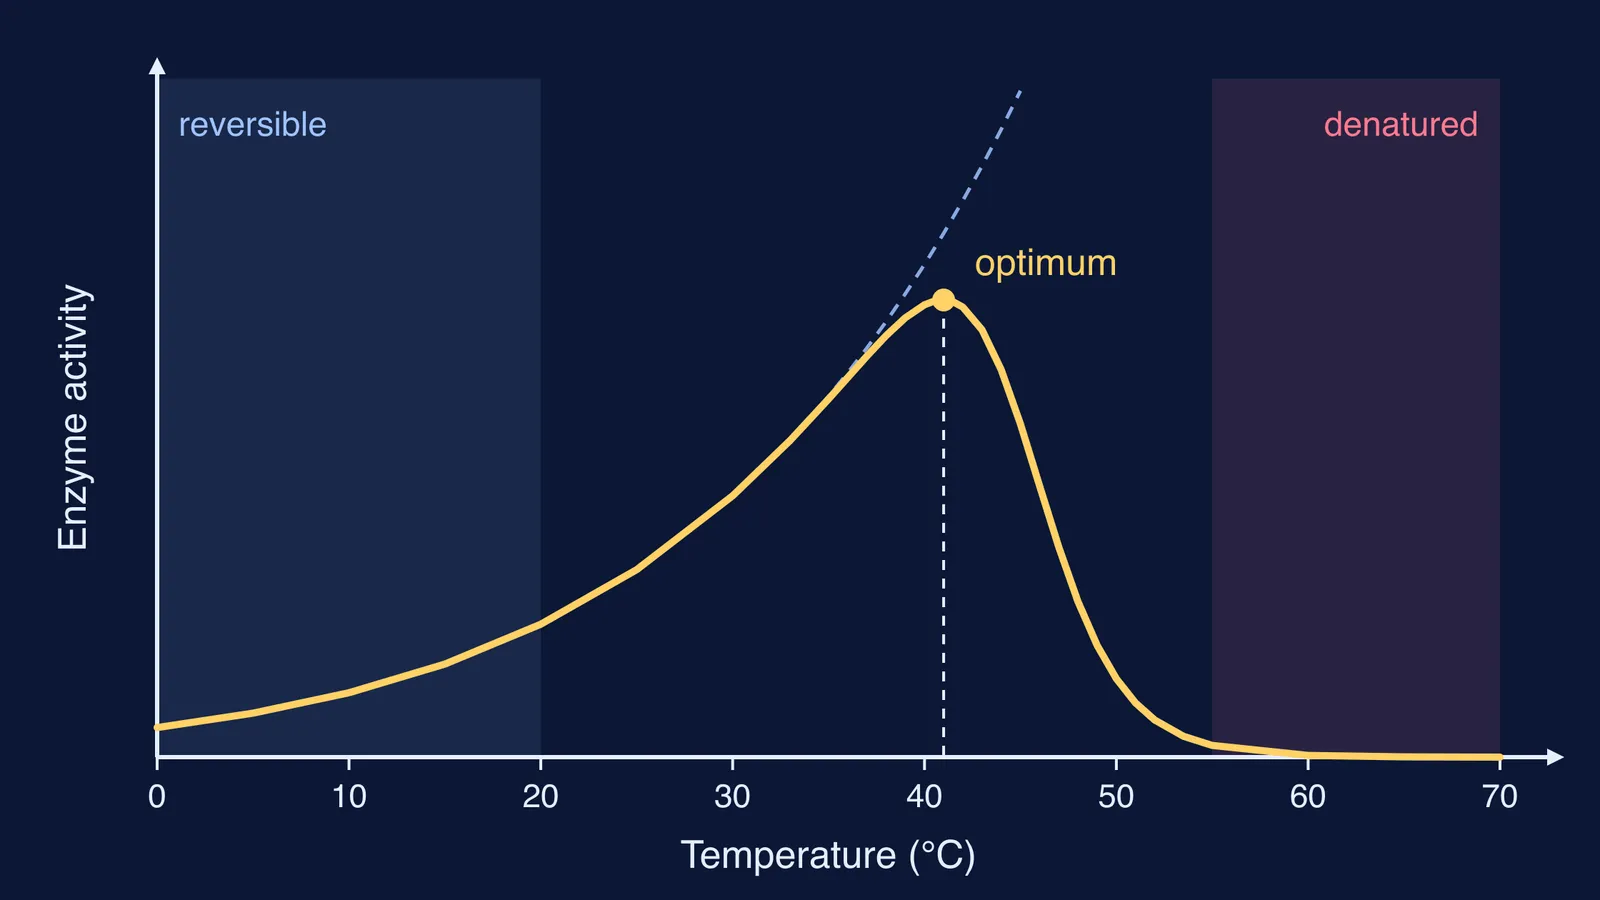
The NCERT Class 11 Biology chapter on biomolecules puts it in one line: each enzyme shows its highest activity at a particular temperature and pH, called the optimum temperature and optimum pH. Its Figure 9.5 draws both as single bell-shaped curves. The same section gives the reason: temperature and pH are conditions that can alter the tertiary structure of the protein, and the active site is a pocket formed by that fold.
The x-value of the peak is the optimum.
The height of the curve is the rate of reaction, not the amount of enzyme.
A narrow hill means the enzyme tolerates only a small range.
Why does enzyme activity drop on each side of the optimum temperature?
Left side (too cold). Molecules move more slowly, so enzyme and substrate meet less often and fewer meetings carry enough energy to react. This is the activation-energy effect, one of the two established thermal properties of enzymes named by Roy Daniel and Michael Danson in Trends in Biochemical Sciences.
Right side (too hot). The extra energy shakes the folded protein apart. The active site loses its shape, the substrate no longer fits, and activity falls fast. This is the second property, thermal stability, running out.
The diagram at the top shows the two effects combined. The dashed line is what the rate would do if the enzyme never unfolded; the solid curve multiplies that rise by the fraction of enzyme still folded. The peak appears where unfolding starts to win. In this model the fall is steeper than the rise because unfolding switches on over a few degrees. NCERT's sketch is more symmetrical; you read both the same way.
How is low-temperature inactivation different from denaturation?
NCERT states it directly: low temperature preserves the enzyme in a temporarily inactive state, whereas high temperature destroys enzymatic activity because proteins are denatured by heat.
Cold: the enzyme keeps its shape. It is slow, not broken. Warm it to the optimum and activity returns.
Heat: the shape is lost. Cool it down and activity does not come back, just as a boiled egg white stays solid. Our post on why boiled eggs and curdled milk show protein denaturation explains which bonds break.
Where the optimum sits depends on the enzyme. NCERT notes that enzymes from organisms in hot vents and sulphur springs stay stable up to 80-90 °C; why Taq polymerase is used in PCR covers the one you will meet in biotechnology.
Why does pH change enzyme activity?
pH acts on the charged groups of amino acids, including those in the active site. Change the pH and these groups gain or lose hydrogen ions, so the charges that hold the substrate, and the bonds that hold the fold, change too. Move away from the optimum either way and activity falls; go far enough and the protein unfolds.
A 2017 study in PLOS One gives the optimal pH of pepsin, the stomach's protein-digesting enzyme, as 1.6. In its own tests, pepsin rapidly broke down three test proteins between pH 1.2 and 2.5, and its activity began to decline above pH 2.5.
A 2010 analysis of 310 proteins by Talley and Alexov found that the pH at which a protein is most active correlates with the pH at which it is most stable.
How do you draw these graphs in an exam?
Label the axes: "Enzyme activity" up the side, "Temperature (°C)" or "pH" along the bottom.
Draw one smooth hill with a single peak. No flat top, no second hump.
Drop a dashed line from the peak and label it "optimum".
For temperature, write "reversible" under the left side and "denaturation" under the right.
For pH, put the peak where the question says. For pepsin, that is near pH 1.6, the optimum given in the PLOS One pepsin study.
Worked example. Two tubes of the same human enzyme sit for an hour, one at 4 °C and one at 80 °C, then both go to the optimum temperature. The cold tube recovers, because cold only kept it inactive. The hot tube stays dead, because heat denatured it. On the graph, the cold tube sat on the left slope; the hot tube fell off the right side for good.
For the substrate-concentration graph, see how to read the Lineweaver–Burk plot. Protein structure and activation energy each have their own lesson in the Fermi Concept Library, and the Fermi Problem Library has worked problems with a step-by-step solver that explains the reasoning rather than printing an answer.