On this page
Drop a small magnet through a coil wired to an oscilloscope and you get a dip, a swing through zero, then a taller spike the other way. Here's why, with a worked example to check it.
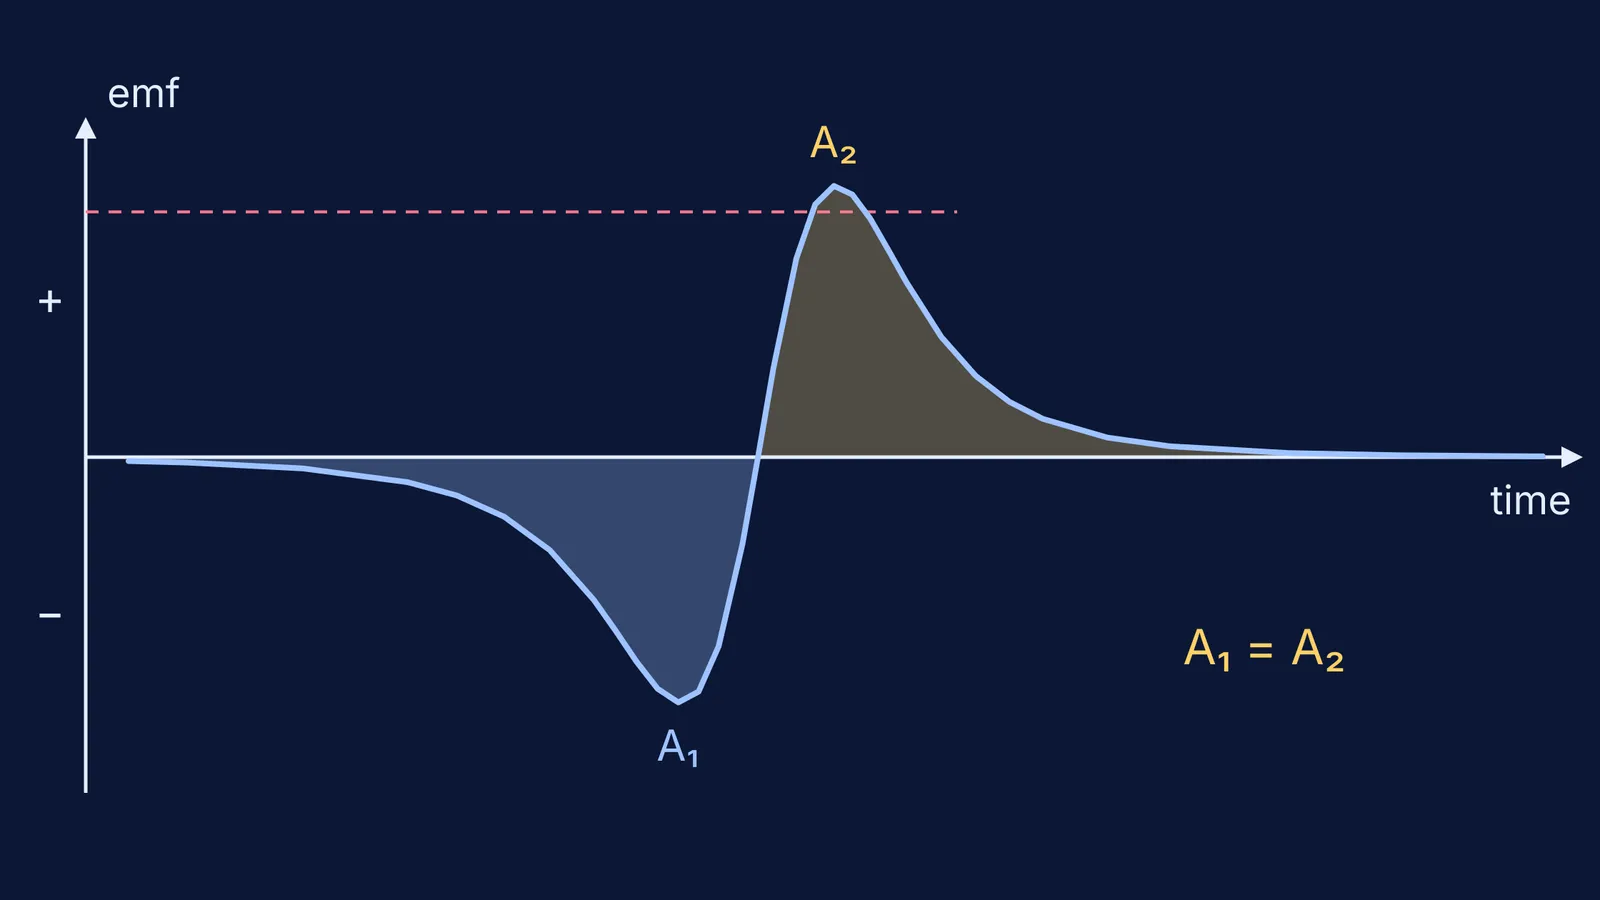
What does the emf-time graph look like when a magnet falls through a coil?
Faraday's law says the emf in a coil of N turns is ε = −N dΦ/dt, where Φ is the flux through one turn (OpenStax University Physics, Faraday's law). So the graph shows how fast the flux is changing, not how big the flux is.
Follow the magnet down:
Far above the coil, the flux is tiny and hardly changing, so the emf is almost zero.
As the magnet nears, the flux grows faster and the emf rises to its first peak.
With the magnet centred, the flux is at its maximum and briefly not changing, so the emf crosses zero.
As the magnet leaves, the flux falls and the emf peaks the other way.
Far below, the emf is zero again.
In a 2014 paper in Physics Education, K M Najiya Maryam dropped a cylindrical magnet (10 mm long, 5 mm across) through a 3000-turn coil and recorded this shape with an expEYES kit (Physics Education, 2014). The measured peaks were −2.560 V and 2.832 V, and they were 13 ms apart.
Why are the two peaks opposite in sign?
Flux increases while the magnet approaches and decreases while it leaves, so dΦ/dt and the emf flip sign. In Lenz's terms, the current first opposes the magnet coming in, then opposes it going away.
Which peak is negative depends on which pole leads and how the meter is connected; flip the magnet and the graph turns upside down. For direction rules, see three common mistakes in finding induced current direction.
Why is the second peak larger than the first?
The magnet is moving faster on the way out. Maryam's paper attributes the bigger second peak to "the acceleration of the magnet as it moves down", and its formula for a small magnet makes emf proportional to the magnet's speed at each position (Physics Education, 2014).
How much taller is the second peak?
For a small magnet on the axis of a coil of radius R, emf at a given speed varies as x(R² + x²)^(−5/2), where x is the magnet's distance from the coil's centre: the form of the paper's small-magnet equation (Physics Education, 2014). Setting the derivative to zero puts the peaks near x = ±R/2, so their ratio is roughly the ratio of speeds there.
Take a 2 cm coil radius and release the magnet from rest 10 cm above the centre, ignoring drag and magnetic braking:
First peak, after 9 cm of fall: v = √(2 × 9.8 × 0.09) ≈ 1.33 m/s.
Second peak, after 11 cm of fall: v = √(2 × 9.8 × 0.11) ≈ 1.47 m/s.
Peak ratio ≈ √(11/9) ≈ 1.11, so the second peak is about 10% taller.
Time between peaks ≈ 2 cm ÷ 1.4 m/s ≈ 14 ms.
This is not the paper's setup, but the numbers are close to its measured ratio (2.832 ÷ 2.560 ≈ 1.11) and 13 ms gap. Drop from 50 cm and the ratio becomes √(51/49) ≈ 1.02: taller, narrower peaks, closer in size.
What do the areas under the two peaks tell you?
Integrating Faraday's law gives ∫ε dt = −N ΔΦ: the area under an emf-time graph is the change in flux linkage, in volt-seconds (webers).
First peak: the flux goes from zero to its maximum Φmax, so the area is NΦmax.
Second peak: the flux goes from Φmax back to zero, so the area is also NΦmax, with the opposite sign.
Whole graph: the two cancel, so the net area is zero.
Speed changes the shape, not the area. In a closed circuit, each pulse pushes a charge NΦmax divided by the circuit's resistance, and the net charge is zero, which is why the charge through a coil does not depend on the magnet's speed. Given a flux-time graph instead, read the emf from its slope.
One caveat: induced current slightly brakes the magnet, but the paper notes the acceleration stays close to g for a small coil.
How do you sketch this graph in an exam?
Zero emf far before and far after the coil.
One peak, then a crossing through zero at the moment the magnet is centred.
A second peak of opposite sign that is taller and narrower.
Two lobes with equal areas.
At constant velocity, equal peaks.
If flux linkage feels shaky, the Fermi Concept Library gives every physics concept its own lesson. To practise variations, the Fermi Problem Library has worked problems with a step-by-step solver that explains the reasoning rather than printing an answer. Change the drop height or flip the magnet, and predict the graph before you check.