On this page
A flux-time graph question looks like a picture, but it is really a slope question. Read the slope of each straight segment, flip the sign, and you have the emf-time graph.
What does Faraday's law say about a flux-time graph?
The NCERT Class 12 Physics chapter on Electromagnetic Induction states the law in words: the magnitude of the induced emf in a circuit is equal to the time rate of change of magnetic flux through the circuit. In symbols that is ε = −dΦ/dt, and for a closely wound coil of N turns it becomes ε = −N dΦ/dt (Eqs. 6.3 and 6.4 in the same chapter).
Magnetic flux is measured in webers, where 1 Wb = 1 T·m², as OpenStax University Physics Volume 2 sets out. A slope in webers per second is a value in volts, which is why reading the slope gives you the emf directly.
The same OpenStax section explains that the minus sign tells you the direction in which the emf drives current, a direction most easily found with Lenz's law. For graph questions, the sign rule is simple: the emf has the opposite sign to the slope.
How do you get emf versus time from a flux-time graph?
Use this five-step routine on any graph made of straight segments.
Mark every corner of the flux graph with a dashed vertical line. Each gap between two lines is one segment.
For each segment, read the slope: change in Φ divided by change in t, with units.
Flip the sign. That is the emf for the whole segment, because a straight line has one slope.
Multiply by N if the question is about a coil, not a single loop.
Draw each emf as a horizontal line over its time interval. Jumps happen only at the corners.
Worked example: four straight segments
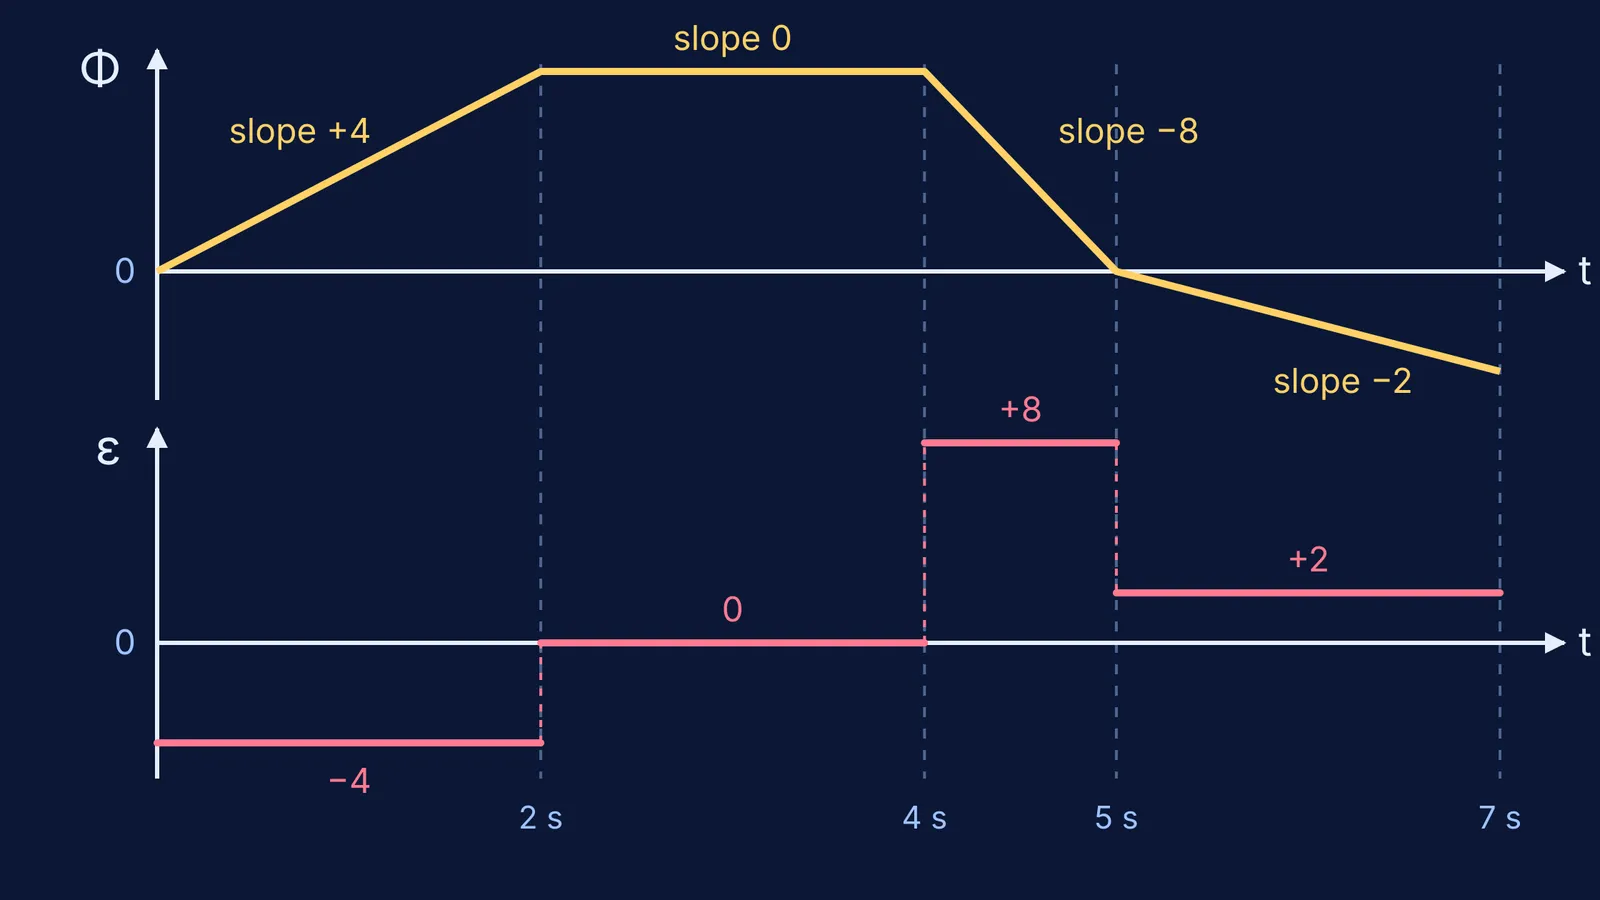
The diagram at the top shows this flux through a single loop:
0 to 2 s: rises from 0 to 8 mWb
2 to 4 s: stays at 8 mWb
4 to 5 s: falls from 8 mWb to 0
5 to 7 s: falls from 0 to −4 mWb
Now apply the routine.
0 to 2 s: slope = (8 − 0)/(2 − 0) = +4 mWb/s, so ε = −4 mV.
2 to 4 s: slope = 0, so ε = 0.
4 to 5 s: slope = (0 − 8)/(5 − 4) = −8 mWb/s, so ε = +8 mV.
5 to 7 s: slope = (−4 − 0)/(7 − 5) = −2 mWb/s, so ε = +2 mV.
The emf-time graph is four flat steps: −4, 0, +8 and +2 mV. If the question gives a coil of 50 turns instead, every step is 50 times larger: −200, 0, +400 and +100 mV.
It works because adding ε × Δt over every segment gives back −ΔΦ, so a sign slip shows up at once.
Why is the emf not zero when the flux is zero?
This is a common mistake on these questions. The emf depends on how fast the flux is changing, not on how much flux there is. Look at the example again:
At t = 5 s the flux is exactly zero, yet the emf just after it is +2 mV, because the line is still sloping.
Between 2 and 4 s the flux is at its largest, 8 mWb, yet the emf is zero, because the line is flat.
The 4 to 5 s segment gives the largest emf, +8 mV, because it is the steepest line, not the highest one.
A segment below the axis can still give a positive emf.
At a sharp corner the slope is undefined and the emf jumps; real graphs have rounded corners, so real emf changes fast but not instantly. If a segment is curved, the emf is not constant: you are sketching a derivative, exactly as in how to sketch the derivative graph from a function.
How to practise this so it sticks
Before calculating, mark the corners, say whether each segment is rising, flat or falling, and predict each emf's sign. Then calculate, draw the steps and run the area check.
If you keep getting the sign or the factor of N wrong, work through a few problems where you can see each step. The Fermi Problem Library has worked problems with a step-by-step solver that explains the reasoning rather than printing an answer. If the gap is in the idea of flux itself, the Fermi Concept Library gives each concept its own lesson.
For where this law came from, read how Michael Faraday discovered electromagnetic induction in 1831. For a case where you must first build the flux expression yourself, try induced emf in a loop near a long wire, step by step.