

On this page
When you first learn calculus, the derivative can feel like an abstract equation. But fundamentally, a derivative is just the slope of a curve at any given point. If you have the graph of a function, you can draw the graph of its derivative without knowing a single algebraic formula.
Learning to sketch the graph before you plot it is a powerful way to check your work. By reading the slopes of the original function, you can build the derivative graph step by step.
Where does the derivative graph cross the zero line?
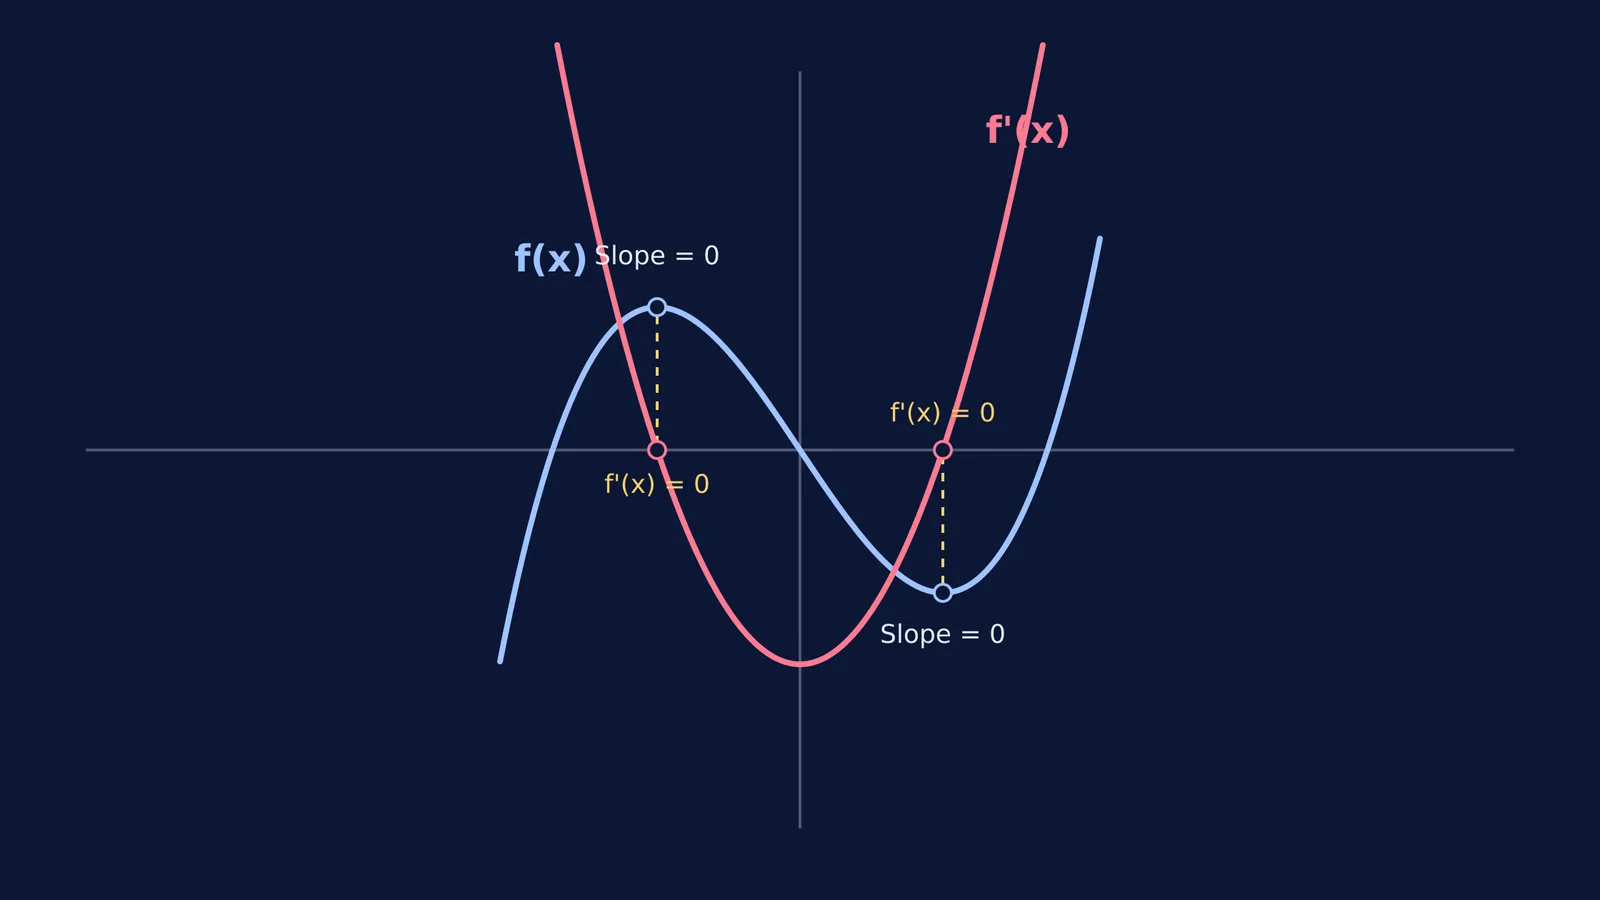
The easiest places to start are the points where the slope is zero. Imagine walking along the original graph. When you reach the top of a hill (a peak) or the bottom of a valley (a trough), the ground is perfectly flat for an instant.
As defined in OpenStax Calculus Volume 1, a function has a horizontal tangent when its slope—and therefore its derivative—is exactly zero (OpenStax).
To map this onto your sketch:
Find every local maximum and minimum on the original graph.
Drop a vertical line straight down (or up) to the x-axis.
Plot a point on the x-axis. These are the x-intercepts of your derivative graph.
How do you know if the derivative is positive or negative?
Once you have your zero points, the x-axis is divided into sections. For each section, look at what the original function is doing.
Rising: If the original function is increasing (going uphill from left to right), its slope is positive. Your derivative graph must be drawn above the x-axis.
Falling: If the original function is decreasing (going downhill), its slope is negative. Your derivative graph must dip below the x-axis.
For example, imagine a roller coaster track. Just because the coaster is 50 metres in the air (a positive y-value) does not mean it is climbing. If the coaster is plunging towards the ground, its slope is negative. Always focus on the direction of the movement, not the altitude.
How do you handle steepness and inflection points?
The steepness of the original graph tells you how far away from the x-axis the derivative should be.
If the original curve has a gentle incline, the derivative is small and stays close to the x-axis. If the curve is very steep, the derivative will stretch far above or below the axis.
Eventually, a steep slope often has to level off to reach a peak or trough. The point where the slope is at its absolute steepest is called a point of inflection (the point where the curve changes from concave up to concave down). On your derivative sketch, this steepest point becomes a local peak or trough. (This concept is also crucial when working out the second derivative of an implicit function, which measures concavity).
What happens at straight lines or sharp corners?
Not every graph is a smooth, curving wave. Sometimes you will encounter straight lines or sudden angles.
Straight lines: If the original function is a straight diagonal line, its slope never changes. The derivative is a constant number. On your sketch, this translates to a perfectly horizontal line.
Sharp corners: If a graph comes to a sudden point—like the bottom of a V-shape—the slope changes instantly without smoothly flattening out. At this exact point, the derivative does not exist. You show this on your sketch by drawing an open circle (a "hole") in the derivative graph, indicating a break or jump in the value.
This helps you spot when a continuous function is not differentiable everywhere.
A checklist for sketching derivatives
Next time you need to sketch a derivative, follow this plan:
Plot the zeros: Find peaks and troughs on the function, and mark those x-values as zero on your derivative graph.
Mark the signs: Put a small "+" in regions where the function is climbing, and a "−" where it is falling.
Find the extremes: Identify the steepest parts of the original graph and sketch peaks or troughs on the derivative there.
Check for breaks: If the original function has a sharp corner or vertical jump, leave an open circle in your derivative graph to show the derivative is undefined there.
Connect smoothly: Draw a smooth line through your zeros, staying in the correct positive or negative regions.
If you are struggling to picture why the slope changes, visualising the derivative as the slope of a tangent can help connect the geometry to the algebra.
How Fermi can help you practice
If you get stuck on a difficult graph, the Fermi Concept Library maps out calculus concepts so you can see exactly how they fit together. When working through homework, you can sketch a graph, show it to Fermi's AI tutor, and ask, "Did I map the inflection point correctly?" Rather than just giving you the answer, the tutor will point out where your signs or intercepts might be off, helping you build the intuition to do it yourself next time.


