

On this page
A graphing app draws any function in a second. That is useful, but it skips the part that teaches you something: deciding what the curve should look like. The fix: predict the shape, plot it, then study where you were wrong.
Why should you sketch a graph before plotting it?
Watching the right answer appear is not the same as working it out. In a study of physics classroom demonstrations, Crouch, Fagen, Callan and Mazur (American Journal of Physics, 2004) found that students who only watched a demonstration understood the concept no better than students who did not see it at all. Students who predicted the outcome before watching showed significantly greater understanding.
A wrong guess still helps. In experiments by Kornell, Hays and Bjork (2009), people who tried to answer a question, failed and were then shown the answer learned better than people who read the question and answer together. A wrong sketch shows you exactly where your picture of the function is off.
What do you check before sketching a function?
Ask the same six questions every time, in this order:
Domain: where is the function undefined?
Intercepts: put x = 0 for the y-intercept, and solve f(x) = 0 for the x-intercepts.
Holes or vertical asymptotes: at each excluded point, does a factor cancel (a hole) or does f blow up (an asymptote)?
End behaviour: as x goes to plus or minus infinity, does f approach a horizontal line, a slanted line, or neither?
Sign: between the zeros and asymptotes, is the curve above or below the x-axis?
Special points: one maximum, minimum or limit you can work out.
Draw dashed asymptotes, mark the intercepts, join them to fit the signs, and only then open the graphing tool.
Which graphs do students usually get wrong?
Sketch each of these on paper before reading the explanation.
f(x) = (x² − 1)/(x − 1). The usual guess is a vertical asymptote at x = 1. But the factor (x − 1) cancels, so the graph is the line y = x + 1 with one point missing at (1, 2). A zero in the denominator gives an asymptote only when it does not cancel.
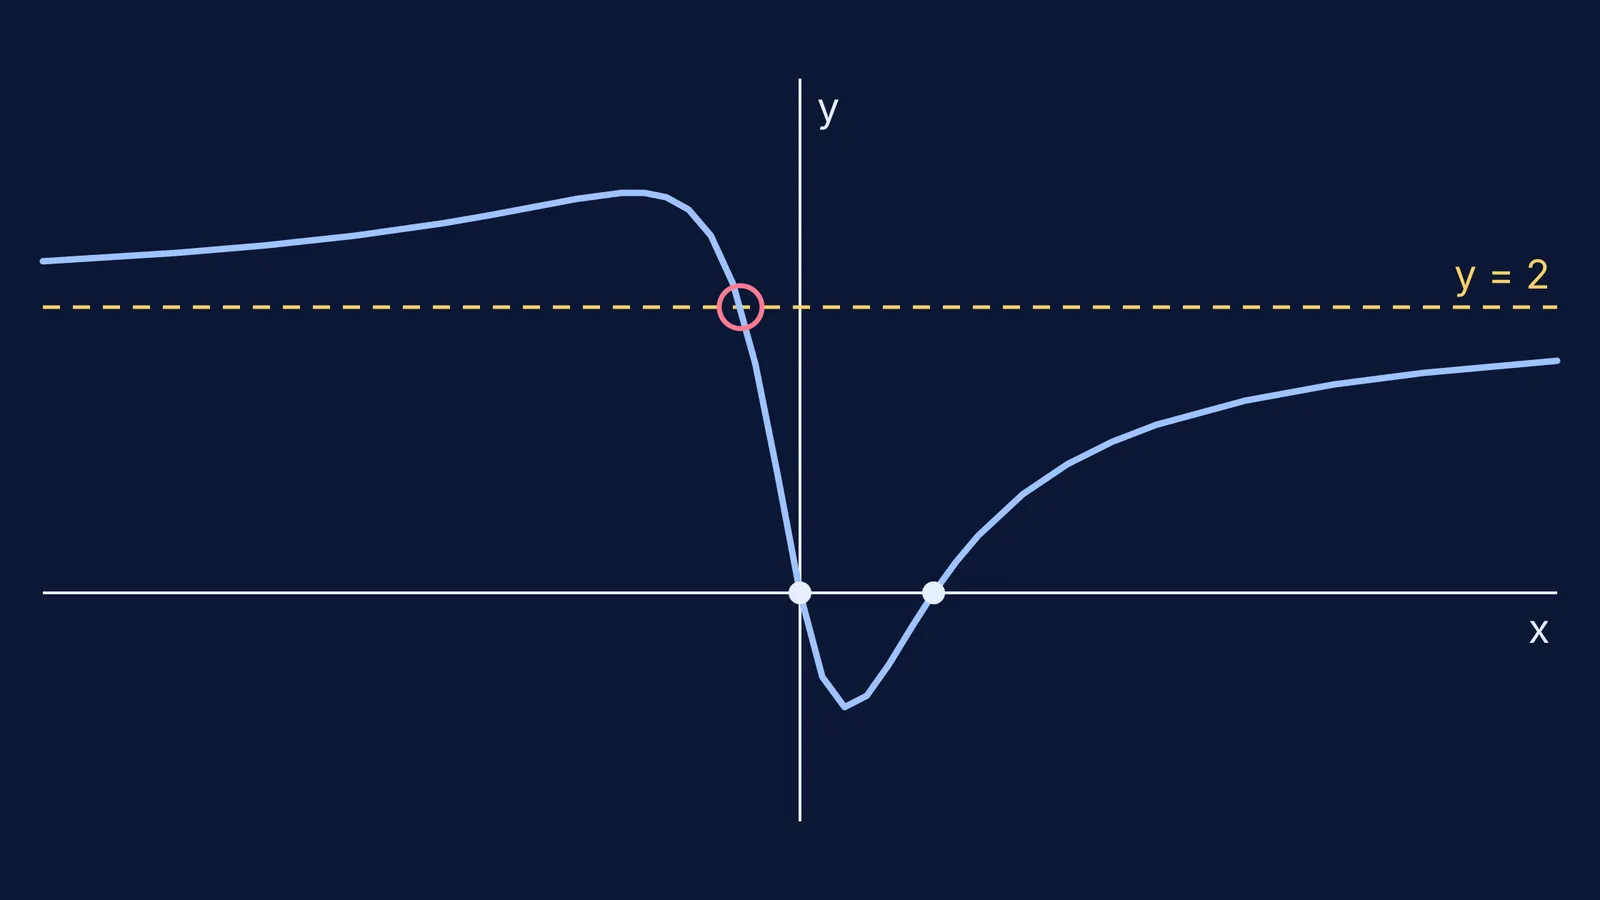
f(x) = (2x² − 3x)/(x² + 1). The usual guess is a curve that creeps towards y = 2 and never touches it. Solving f(x) = 2 gives x = −2/3, so it does cross. From the far left the curve sits just above 2, peaks at about 2.8 near x = −1.9, falls through y = 2 at x = −2/3, dips to about −0.8, then climbs back towards 2 from below. "Never crosses" is true of vertical asymptotes only. This is the curve pictured above.
f(x) = x + 1/x. The usual guess is that it flattens out. As x grows, 1/x shrinks to zero, so the graph hugs the slanted line y = x. There is a vertical asymptote at x = 0, and for positive x the lowest point is (1, 2).
f(x) = sin x / x. The usual guess is a vertical asymptote at x = 0. But sin x / x tends to 1 as x tends to 0, so the curve passes through height 1 with just a missing point. Away from zero it wiggles between y = 1/x and y = −1/x and dies out.
f(x) = x e^(−x). The usual guess is that it grows because x grows. For large positive x the exponential wins and f goes to 0; for negative x, f goes to minus infinity. In between there is one peak, at x = 1, of height 1/e, about 0.37.
U(r) = 4ε[(σ/r)¹² − (σ/r)⁶]. Physics students meet this shape as the potential energy of two neutral atoms a distance r apart. The usual guess puts the lowest point where U = 0. In fact U = 0 at r = σ, and the minimum lies further out, at r = 2^(1/6)σ, about 1.12σ, where U = −ε.
How do you turn this into a weekly habit?
Pick three functions from your current chapter or its exercise.
Spend at most five minutes on each sketch. Rough is fine; the prediction is the point.
Plot each one and mark every mismatch in a different colour.
Keep a "graph mistakes" page. After a few weeks your pattern shows, such as treating every zero in a denominator as an asymptote.
In physics, ask the same of a formula before putting numbers in: what happens as r goes to 0?
Parents can help without knowing the maths: "What did you expect, and what surprised you?"
The Fermi Simulation Lab has interactive simulations for ideas that are easier to see than to read, so you can make your prediction first and then test it. If your sketch went wrong because of an algebra slip, the Fermi Problem Library has worked problems with a step-by-step solver that explains the reasoning.
Next time you reach for the plot button, draw the curve first and use the plot to check it.


