

On this page
Most students meet the derivative as a rule: bring the power down, subtract one. That works until a question asks what the number means. Two pictures make the meaning visible: zooming in until a curve looks straight, and sliding a secant until it becomes a tangent.
What does "derivative as slope of a tangent" mean?
A secant is a line through two points on a curve, (a, f(a)) and (a + h, f(a + h)), and its slope is [f(a + h) − f(a)]/h, as defined in OpenStax Calculus Volume 1, section 3.1.
The same OpenStax section defines the tangent at a as the line through (a, f(a)) whose slope is the limit of those secant slopes, provided the limit exists, and calls that limit the derivative f′(a).
So the derivative is an ordinary slope, rise over run, taken over a run so small that the second point no longer matters.
Why does a curve look straight when you zoom in?
The mathematics educator David Tall calls this local straightness. On his page on local straightness he writes: "A graph is said to be locally straight if it magnifies to ‘look straight’ everywhere along its length." The slope of that nearly straight magnified piece is the gradient you see, and calculated exactly it is the derivative.
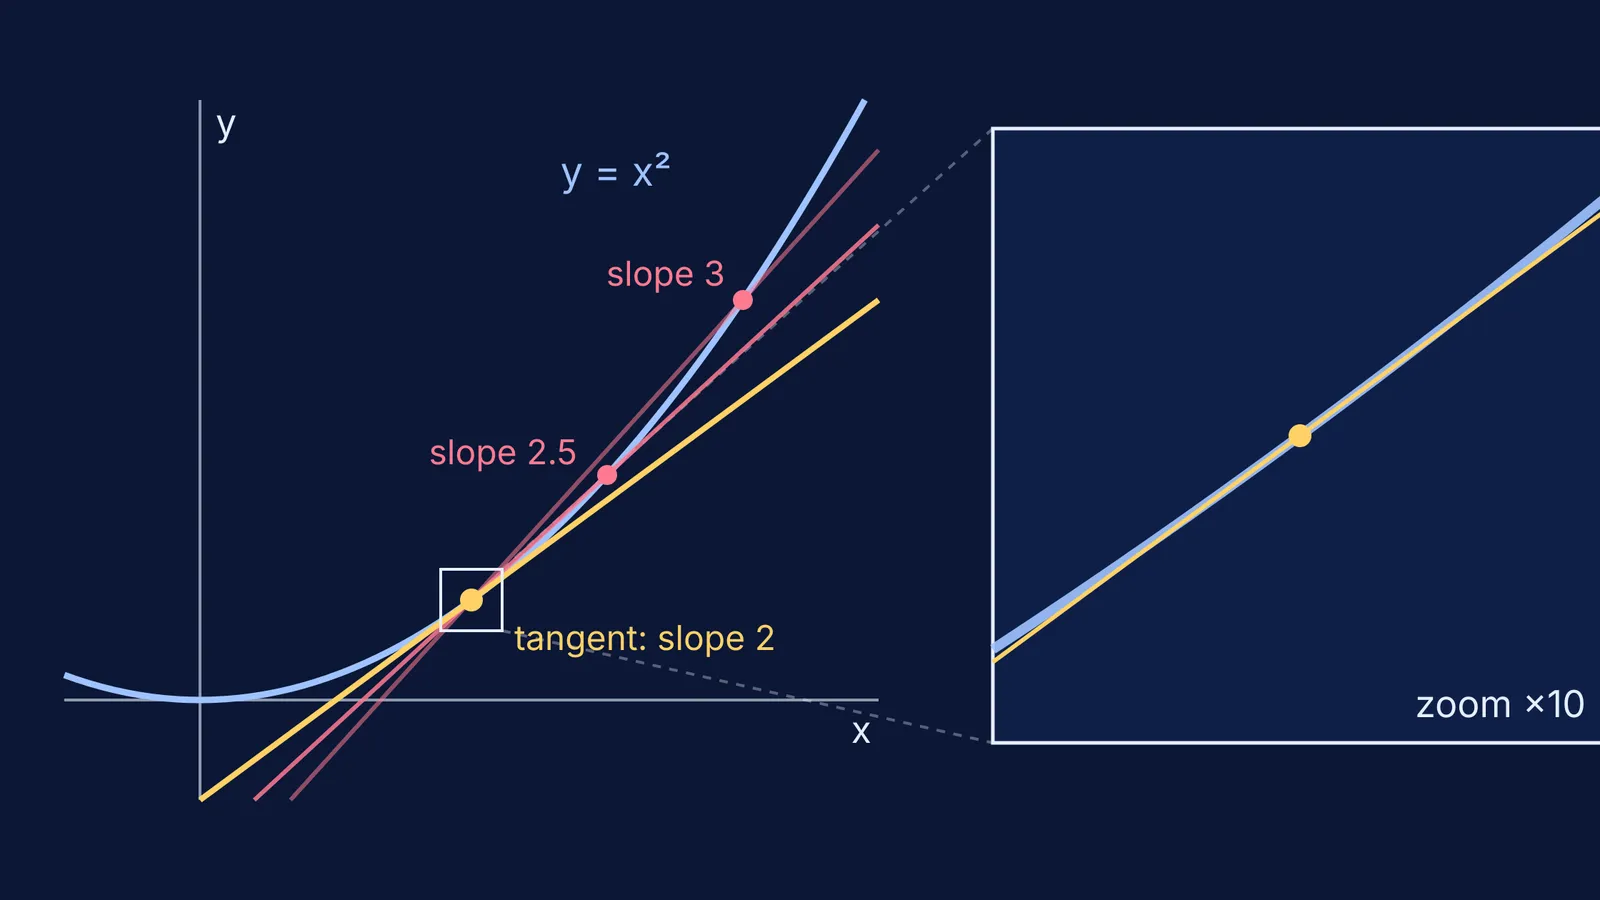
You can check this with plain algebra. For y = x², the tangent at x = 1 is y = 2x − 1, and the gap between curve and tangent is x² − (2x − 1) = (x − 1)². In a window of half-width w around x = 1, the tangent rises 2w from centre to edge while the curve pulls away from it by only w². The bend you can see is w/2 of the rise:
w = 1: the gap is half the rise, a clear curve.
w = 0.1: the gap is 5% of the rise, a slight bend.
w = 0.01: the gap is 0.5% of the rise, too small to see.
Each tenfold zoom straightens the picture tenfold, as the inset in the diagram above shows.
How does a secant turn into a tangent?
Take y = x² at a = 1. The secant slope is [(1 + h)² − 1]/h = (2h + h²)/h = 2 + h. Now slide the second point in:
h = 1: the second point is (2, 4) and the slope is 3.
h = 0.5: the point is (1.5, 2.25) and the slope is 2.5.
h = 0.1: the slope is 2.1.
h = 0.01: the slope is 2.01.
h = −0.1, from the left: the slope is 1.9.
From both sides the slopes close in on 2, so f′(1) = 2, matching the power rule. If the limit step feels shaky, our post on derivatives from first principles in Class 11 works through more functions the same way.
To build this in any graphing tool, plot f(x), add a slider for h, and plot y = f(a) + [(f(a + h) − f(a))/h](x − a). Drag h towards 0 and the line pivots about (a, f(a)). See also using graphing tools to learn calculus, not skip it.
Why predict the slope before checking?
In a 2004 study in the American Journal of Physics, Catherine Crouch, Eric Mazur and colleagues found that students who only watched classroom demonstrations understood the concepts no better than students who did not see them, while students who predicted the outcome first showed significantly greater understanding.
A graph you drag around is a demonstration too. So before each check, commit to a number on paper.
Use this routine for any new function:
Plot the curve and mark your point.
Say whether the slope is positive, negative or zero, and how steep.
Write a number down.
Zoom in until the curve looks straight and read rise over run.
Check with the derivative. If you were far off, ask what in the picture misled you.
To drag the point and secant instead of drawing them, the Fermi Simulation Lab has interactive simulations for ideas that are easier to see than to read. Our piece on simulations versus static diagrams covers when moving pictures help.
What if the curve never looks straight?
Try y = |x| at x = 0. Secants to the right all have slope 1, and secants to the left all have slope −1. However far you zoom, you still see a V, so the one-sided limits disagree and there is no derivative there. It shows that a function can be continuous at a point without being differentiable.
If the idea of a limit itself is the sticking point, the Fermi Concept Library gives each concept in mathematics its own lesson. Then pick a curve and predict three slopes before you calculate any.


