On this page
This is a classic Class 11 and JEE Main question. A train starts from rest and speeds up uniformly at α. Then it slows down uniformly at β (the retardation) until it stops. The whole trip takes time t. Find the maximum speed and the distance covered. Many students go straight to v² = u² + 2as, end up with two unknown distances and get stuck. One picture gets you there faster.
Why does a velocity-time graph solve this so quickly?
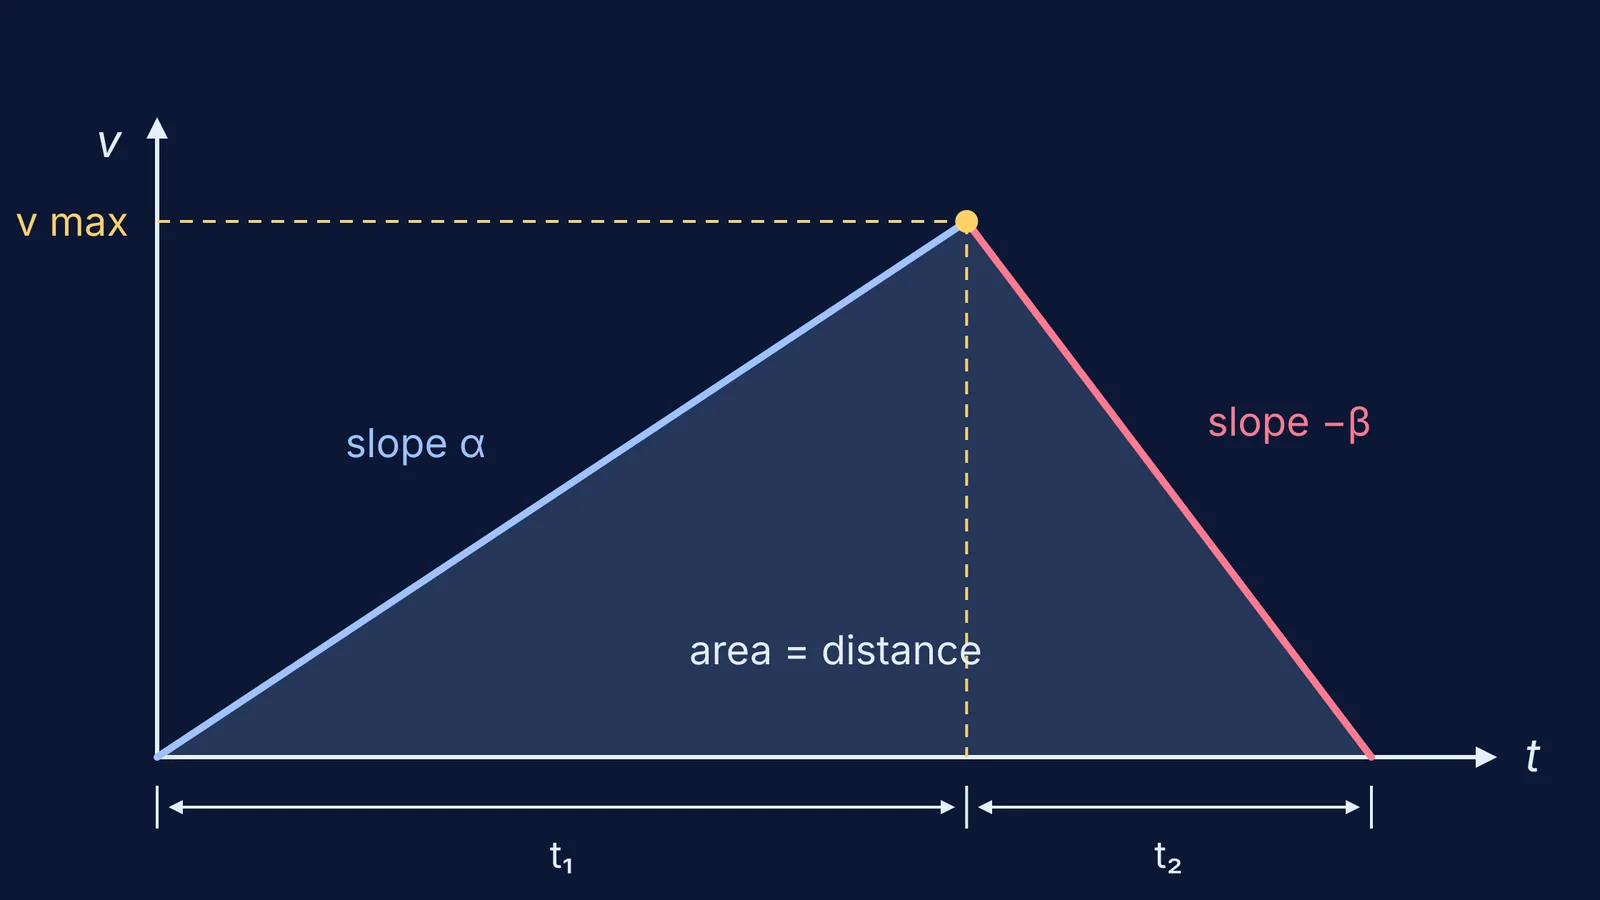
Put velocity on the vertical axis and time on the horizontal one. Speeding up at a steady rate gives a straight line rising from the origin. Slowing at a steady rate gives a straight line falling back to zero. Together they make a triangle, and the top corner is the maximum speed.
The NCERT Class 11 physics chapter on motion in a straight line gives you the two facts you need. The acceleration at any instant is the slope of the velocity-time graph. The area under a velocity-time graph equals the displacement over that time interval. For how the equations of motion follow from them, see deriving the equations of motion from a velocity-time graph.
Retardation β just means an acceleration of size β that acts against the motion. On the graph it is the falling line, with slope −β. In the formulas below, β is always a positive number.
How do you find the maximum speed?
Call the time spent speeding up t₁ and the time spent braking t₂, so t₁ + t₂ = t. Apply v = u + at, as given in NCERT and in OpenStax University Physics, to each stage:
Speeding up from rest: v max = αt₁, so t₁ = v max/α.
Braking to rest: 0 = v max − βt₂, so t₂ = v max/β.
Add the two times: v max/α + v max/β = t.
Solve: v max = αβt/(α + β).
The split of time follows from steps 1 and 2: t₁/t₂ = β/α. The train spends longer in the gentler phase. As a quick check, if α = β the triangle is symmetric and v max = αt/2.
How far does the train travel?
The distance is the area of the triangle, half of base times height: s = ½ × v max × t = αβt²/(2(α + β)).
There is a second way to see this. For constant acceleration, the average velocity is the plain average of the starting and final velocities, (u + v)/2, as OpenStax shows. Both stages run between 0 and v max, so each averages v max/2, and so does the whole trip. Our post on when average velocity really is (u + v)/2 explains why that shortcut only works for constant acceleration.
A common variant turns the question around: it gives the distance s and ask for the least time. Rearranging gives t = √(2s(α + β)/(αβ)) and v max = √(2sαβ/(α + β)).
Worked example: a train between two stations
This example uses only the equations from the NCERT chapter. A local train leaves a station from rest and speeds up at 0.5 m/s². It then brakes at 1 m/s² and stops at the next station 90 s after leaving.
Maximum speed: v max = (0.5 × 1 × 90)/(0.5 + 1) = 45/1.5 = 30 m/s, which is 108 km/h.
Time in each stage: t₁ = 30/0.5 = 60 s speeding up and t₂ = 30/1 = 30 s braking. They add up to 90 s, as they should.
Distance: s = ½ × 30 × 90 = 1350 m, so the stations are 1.35 km apart.
Stage-by-stage check with v² = u² + 2as: 30²/(2 × 0.5) = 900 m speeding up, then 30²/(2 × 1) = 450 m braking. 900 + 450 = 1350 m. This check catches algebra slips before they cost marks.
What mistakes cost marks on this question?
Assuming the two stages take equal time. That is only true when α = β.
Writing α + β where αβ/(α + β) belongs. The combination works like resistors in parallel: it is always smaller than both α and β.
Counting the minus sign twice. Use β as a positive size in the formula and let the falling line on the graph carry the direction.
Missing a constant-speed stage. If the train cruises for a while, the triangle becomes a trapezium. The area still gives the distance.
Treating every area as positive. If the velocity ever goes below zero, that area counts as negative displacement, as our post on negative area under a velocity-time graph shows.
If you set up the stages correctly but keep slipping in the algebra, the Fermi Problem Library has worked problems with a step-by-step solver that explains the reasoning rather than printing an answer. If slope and area on a velocity-time graph still feel shaky, the Fermi Concept Library gives every physics concept its own lesson. Then draw the triangle once more, from memory, before your next mock test.