

On this page
When you first learn calculus or kinematics in Class 11, 'area under a curve' sounds straightforward: multiply dimensions, find geometric area, and get an answer. Yet on a velocity-time (v–t) graph, geometric intuition frequently trips students up on JEE Main and NEET-UG questions. While physical area on paper is always positive, kinematics treats any region below the time axis as motion in the opposite direction.
In a study of 895 students published in the American Journal of Physics, researcher Robert J. Beichner found that average scores on the Test of Understanding Graphs in Kinematics were only around 40%, with students routinely struggling to interpret the physical meaning of graph area (Beichner, 1994). Lillian C. McDermott and colleagues at the University of Washington similarly found that students frequently confuse graph shapes with physical paths and struggle with negative motion (McDermott et al., 1987).
Why does the area under a velocity-time graph represent displacement?
Velocity is the time rate of change of position: v = dx/dt. Rearranging gives dx = v dt, so integrating velocity over time yields the net change in position:
Δx = ∫ v dt from t₁ to t₂.
Multiplying the vertical axis (metres per second) by the horizontal axis (seconds) gives metres: (m/s) × s = m. The definite integral calculates the accumulated signed area between the curve and the time axis. When you master reading physics graphs, you realise that this area tracks forward and backward progress rather than two-dimensional paper surface.
What does negative area below the time axis physically mean?
A study of 471 physics students published in Physical Review Physics Education Research showed that negative values and negative areas remain persistent pitfalls, as students often treat area as unsigned distance (Zavala et al., 2017). The sign of velocity specifies direction. Above the horizontal axis, positive velocity means forward motion along the coordinate axis. Below the axis, negative velocity means the object is moving backward toward or past the origin.
Because the height of any strip below the axis is negative, its contribution to the integral is (−|v|) dt = −(|v| dt). Area below the axis therefore represents negative displacement. The point where the graph crosses the axis (where v = 0) marks the exact instant the object halts and reverses direction. For students mapping core kinematics ideas, the Fermi Concept Library covers every concept in physics, chemistry, biology, mathematics and computing, each with its own lesson and its place in the map.
How do you find total distance versus net displacement?
Displacement is a vector measuring net position change: Δx = x_final − x_initial. Distance is a scalar measuring total path length traversed, which can never decrease.
To calculate them from a velocity-time graph:
Net displacement: Add areas algebraically, subtracting area below the axis from area above it: Δx = Area_above − Area_below.
Total distance: Add the absolute magnitudes of all enclosed areas: Distance = |Area_above| + |Area_below|.
Confusing these two definitions causes frequent errors in average speed vs average velocity numericals.
A worked example: calculating displacement and distance from a graph
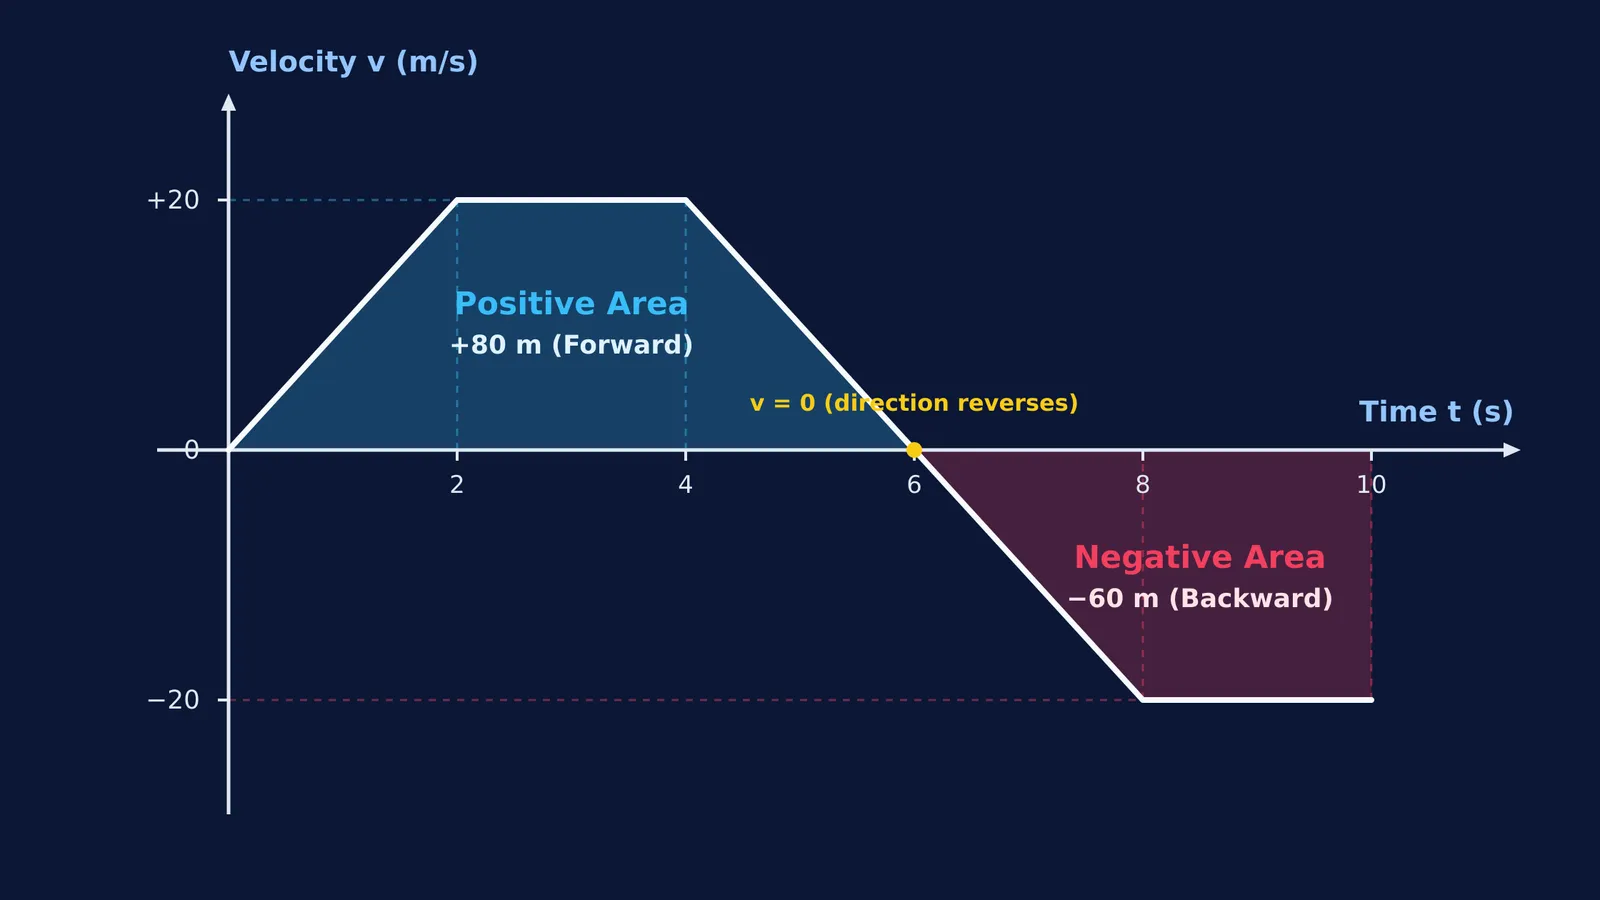
Consider an object moving along a line with two trapezoidal regions on its graph:
Forward interval (t = 0 to 6 s): It accelerates to +20 m/s in 2 s, cruises for 2 s, and decelerates to rest at t = 6 s. The trapezoid has parallel sides of 6 s and 2 s and height 20 m/s: Area_above = 0.5 × (6 + 2) × 20 = +80 m.
Backward interval (t = 6 to 10 s): It shifts into reverse, accelerating to −20 m/s in 2 s and cruising until t = 10 s. The inverted trapezoid has parallel sides of 4 s and 2 s and height 20 m/s: Area_below = 0.5 × (4 + 2) × 20 = 60 m.
From these regions:
Net displacement: Δx = (+80 m) − (60 m) = +20 m.
Total distance: Distance = 80 m + 60 m = 140 m.
Average velocity: v_avg = Δx / Δt = +20 m / 10 s = +2 m/s.
Average speed: Speed_avg = Distance / Δt = 140 m / 10 s = 14 m/s.
Evaluating distance without splitting the area under curves at t = 6 s would overlook the reversal and yield an incorrect answer.
A five-step checklist for kinematics graph questions
Use this checklist whenever solving velocity graph problems:
Identify time-axis intercepts: Mark every point where v = 0 to divide forward and backward intervals.
Shade the regions: Mark areas above the axis as positive and areas below as negative.
Compute geometric areas: Divide regions into standard triangles, rectangles, or trapeziums.
Apply target rules: For displacement, take the signed sum (+A₁ − A₂). For distance, sum magnitudes (A₁ + A₂).
Compute rates: Divide displacement by time for average velocity; divide distance by time for average speed.
For guided numerical practice, the Fermi Problem Library provides worked problems with a step-by-step solver that explains the reasoning rather than printing an answer.


