
On this page
Kinematics graphs look simple, but students misread them in predictable ways. You see a line going up and read "moving up", or see a high point and read "fast". Physics education researchers have studied these misreadings since at least the 1980s, and the same few keep coming back. Here is what the research found, the three rules that fix most of them, and a worked example to practise on.
What the research found
In a multi-year study of several hundred university students in a preparatory physics course, McDermott, Rosenquist and van Zee (1987) found two broad problems. Students struggled to connect graphs to physical concepts, and they struggled to connect graphs to real motion. They also found these errors were not individual quirks; they appeared across different groups of students.
Beichner (1994) built a test of kinematics graph reading and gave it to 895 high school and college students. His paper describes a consistent set of difficulties, which his test was built to measure:
reading a graph as a picture of the path, rather than a plot of a quantity against time
confusing slope with height
finding the slope of a line that doesn't pass through the origin
not knowing what the area under a curve means
The three rules that fix most mistakes
NCERT's Motion in a Straight Line chapter states the key facts:
Slope of a position-time graph is velocity. The velocity at an instant is the slope of the tangent to the position-time curve at that instant.
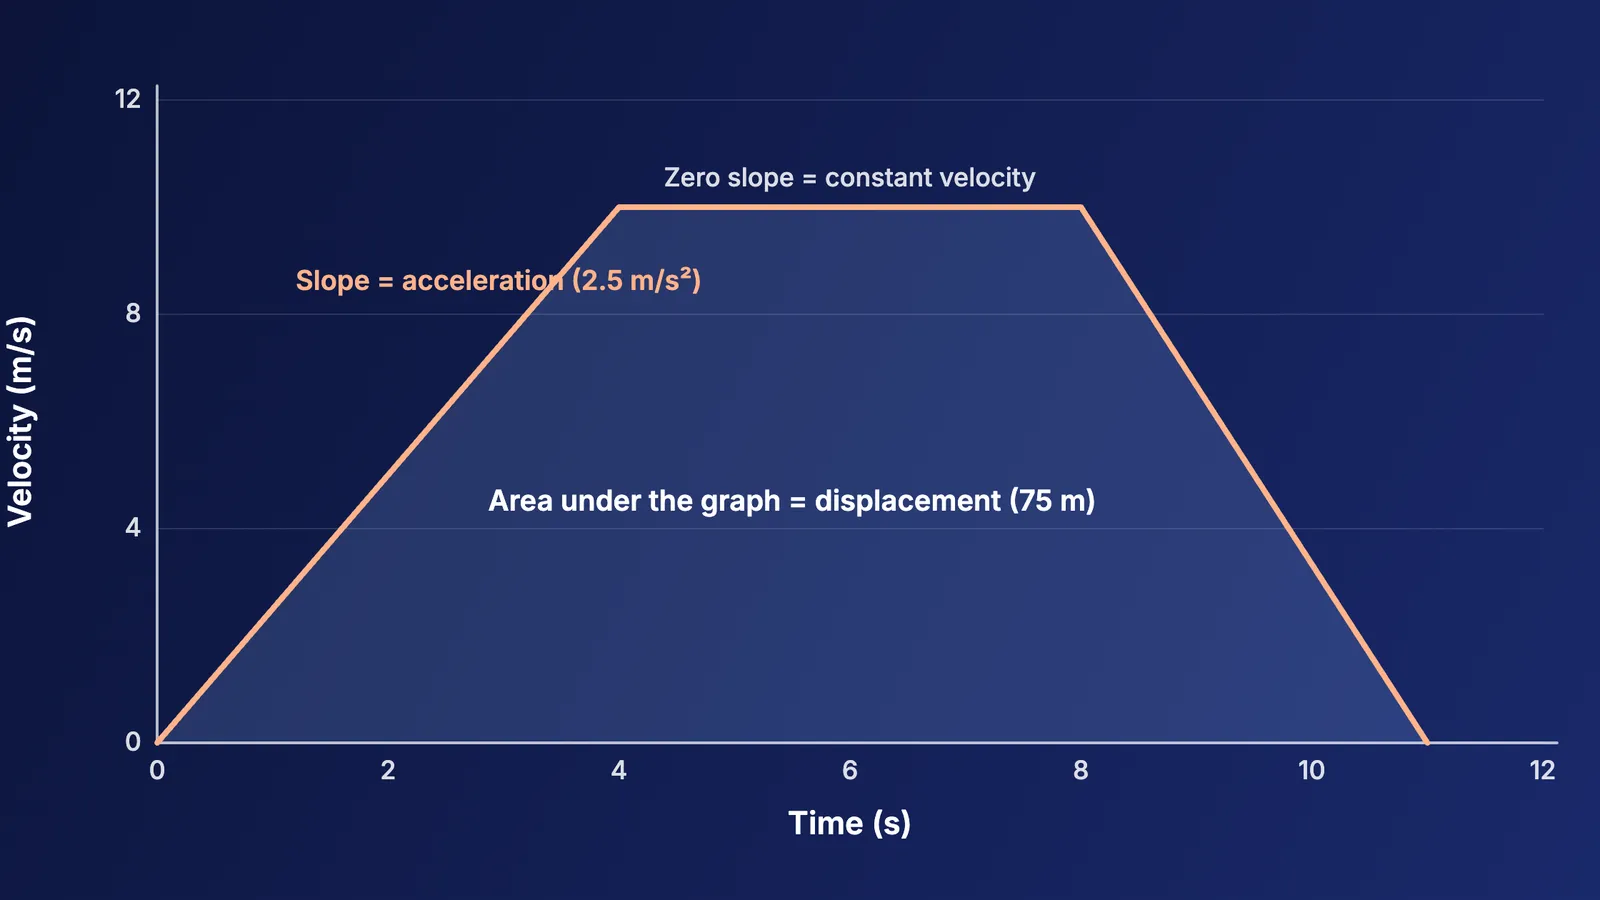
Slope of a velocity-time graph is acceleration. Again, the instantaneous value is the slope of the tangent.
Area under a velocity-time graph is displacement over that time interval.
Before you read any graph, say aloud which quantity is on the vertical axis. That one habit stops you reading the graph as a picture.
Worked example: one graph, three questions
A car's velocity-time graph has three straight pieces:
from 0 to 4 s, velocity rises steadily from 0 to 8 m/s
from 4 s to 10 s, velocity stays at 8 m/s
from 10 s to 12 s, velocity falls steadily to 0
What is the acceleration in the first 4 s? Slope = (8 − 0) ÷ (4 − 0) = 2 m/s².
What is the acceleration between 4 s and 10 s? The line is flat, so the slope is 0. The car is moving fast, but not accelerating. This is the slope-and-height confusion: a high flat line means high speed and zero acceleration.
How far does the car travel in 12 s? Add the areas:
triangle from 0 to 4 s: ½ × 4 × 8 = 16 m
rectangle from 4 to 10 s: 6 × 8 = 48 m
triangle from 10 to 12 s: ½ × 2 × 8 = 8 m
Total: 72 m.
The slope that doesn't start at zero
A position-time graph passes through (2 s, 4 m) and (6 s, 16 m) in a straight line. The velocity is (16 − 4) ÷ (6 − 2) = 3 m/s. A common slip is to divide 16 by 6 and get about 2.7 m/s, which treats the line as if it started at the origin. Always use two points on the line, not one point and zero.
Sketching graphs from a description
Graphs start early in the syllabus: CBSE's Class X science curriculum for 2026-27 lists analysing graphical representations of motion as a competency. When you have to sketch one, use this checklist:
Label both axes with quantity and unit.
Mark the key points first: start, end, and where the motion changes.
Decide the slope of each piece: zero, positive or negative, and constant or changing.
For a position-time graph under constant acceleration, draw a curve, not a straight line. It curves upward when the acceleration is positive and downward when it is negative.
Check that the pieces join without gaps.
Common misreadings, with checks
"The graph goes up, so the object goes up." Check the axis. A rising position-time line means position is increasing, in whatever direction you chose as positive.
"Highest point means fastest." On a smooth position-time curve, a peak is where velocity is momentarily zero, since the tangent is flat there.
"Steeper means faster" on any graph. True for position-time, but on velocity-time, steeper means larger acceleration.
Forgetting units on slopes and areas. A slope on a velocity-time graph is in m/s², and an area is in m.
To build a feel for these links, watch a graph change with the motion. The Fermi Simulation Lab has interactive simulations for ideas that are easier to see than to read. Predict the shape of the graph first, then run the simulation to check.
For the calculus behind slopes and areas, see the calculus you need for JEE physics. For a prediction activity, try learning projectile motion with a simulation. And for related errors, read five JEE mechanics mistakes and the habits that fix them.
Sketch the worked example's graph from memory and find its area again.