
On this page
A school weather station measures air temperature, humidity and rainfall. You can build each instrument from a thermometer, a cloth wick and a plastic bottle, or use a cheap sensor. Either way, good results come from two habits: placing instruments where they read the air, not the sun, and logging at the same time every day.
What do you need to build a weather station for a school project?
Temperature: one ordinary thermometer (or a digital sensor) inside a shaded, ventilated box.
Humidity: a second thermometer with a wet cloth on its bulb, or a digital humidity sensor.
Rainfall: a funnel, a straight-sided bottle or jar, and a measuring cylinder or kitchen measuring jug.
Logging: a notebook or spreadsheet, and a reading time you can keep, such as before school.
If you choose a sensor, check its specification first. Adafruit's guide lists the DHT22 sensor at ±0.5°C and 2-5% humidity accuracy, and the cheaper DHT11 at ±2°C, rated only for 20% to 80% humidity at 5% accuracy (Adafruit). An error of ±2°C can hide the day-to-day changes you want to see.
Where should you put the thermometer and rain gauge?
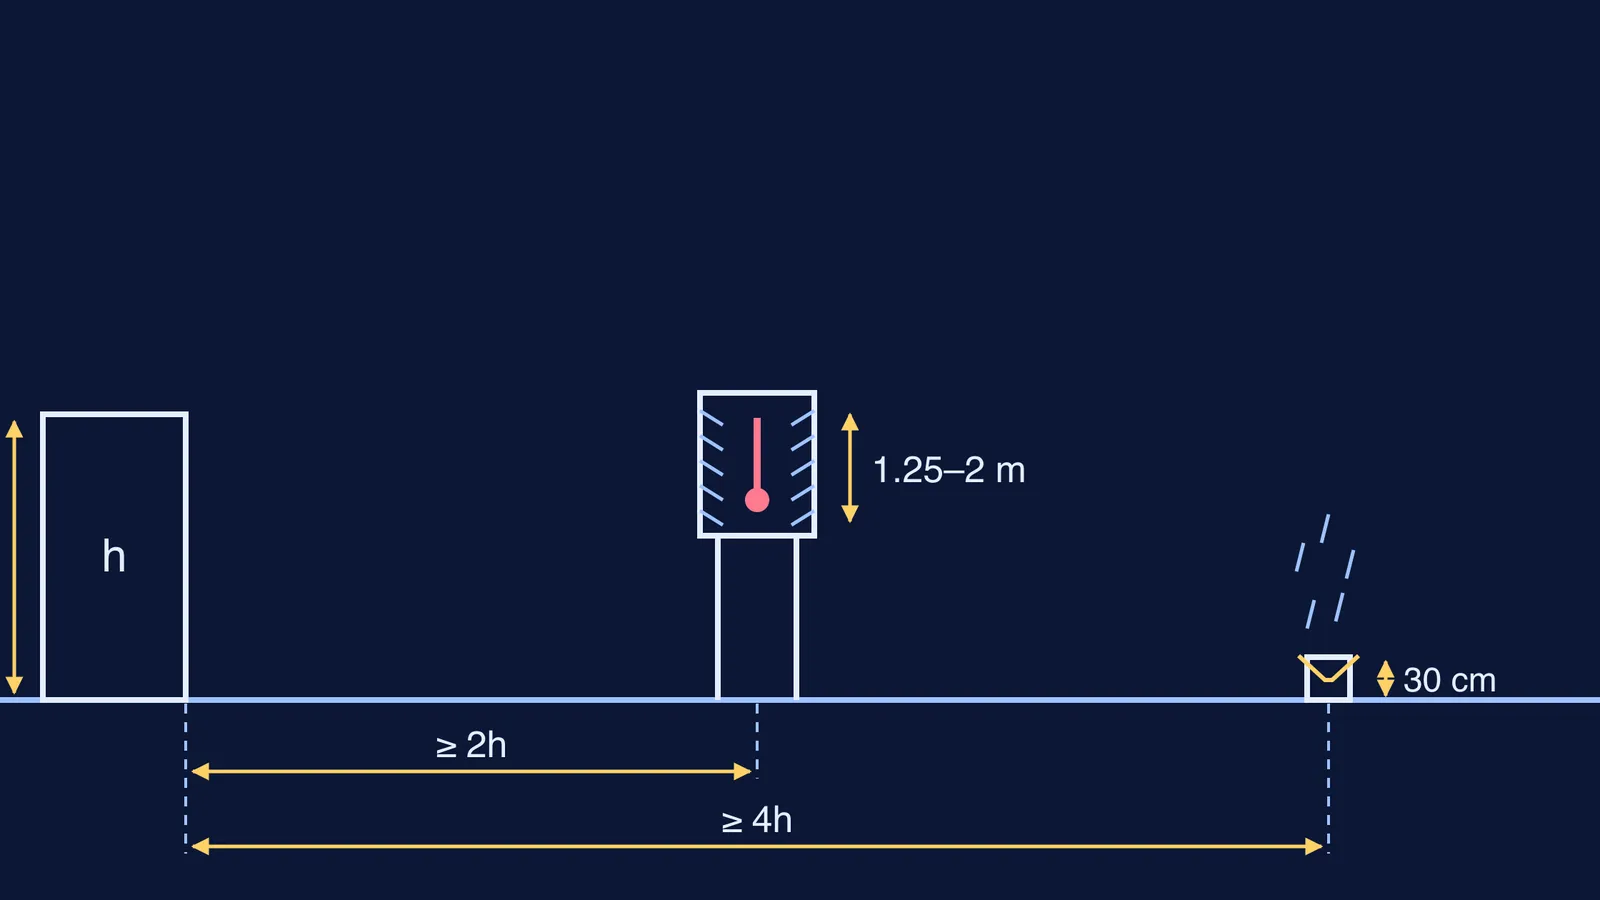
Weather services place thermometers between 1.25 and 2 m above ground (Hong Kong Observatory).
A Stevenson screen is a double-louvred wooden box, painted white, that shields thermometers from sun, rain and heat from the ground while letting air flow over the bulbs (Environment and Climate Change Canada). The same manual asks for short grass underneath, a distance from trees or buildings of at least twice their height, and a north-facing door. Your version can be a white plastic box with slits on every side, on a pole at chest height in the open, never on a sunny wall or hot concrete roof.
For rain, the gauge rim normally sits 30 cm above the ground, and no building or tree should be closer than four times its height (FAO). The same FAO manual warns that wind and exposure errors "can be very large, even more than 50 percent", which is why a gauge beside a wall or on a windy terrace reads wrong.
How do you make a rain gauge and convert water to millimetres?
Rainfall is a depth: how deep water would stand on flat ground if none drained away. One millimetre of rain on one square metre is one litre of water, because 0.001 m × 1 m² = 0.001 m³.
With a straight-sided jar and no funnel, measure the depth with a ruler. With a funnel wider than the bottle, use:
rainfall (mm) = 10 × volume collected (mL) ÷ funnel area (cm²)
Worked example: your funnel mouth is 18 cm across, so its radius is 9 cm and its area is π × 9² ≈ 254.5 cm². After a monsoon shower you pour out 509 mL. Rainfall = 10 × 509 ÷ 254.5 = 20.0 mm. FAO recommends a collector area of 200 to 500 cm² and readings to the nearest 0.1 mm (FAO), so an 18 cm funnel is a sensible size.
How do you measure humidity without a sensor?
Relative humidity tells you how full the air is with moisture compared with the most it could hold at that temperature (The Old Farmer's Almanac).
The Almanac's sling psychrometer guide says to wrap gauze round one thermometer's bulb, wet it, and swing or fan the pair for 2 to 3 minutes or until the wet-bulb reading stops falling. Evaporation cools the wet bulb, and it cools more in dry air, so a bigger gap between the two thermometers means drier air. Read the relative humidity off a psychrometric table or online calculator, and note which you used.
If the physics of evaporative cooling feels hazy, the Fermi Concept Library has a lesson for each concept in physics and chemistry to read before your viva.
How should you log and present the data?
Use one line per day with fixed columns: date and time, dry-bulb °C, wet-bulb °C, relative humidity %, rainfall mm (then empty the gauge), and notes on sky and wind.
A two-week plan fits most deadlines:
Days 1-2: build, run the 100 mL test, and check both thermometers agree side by side in shade.
Days 3-12: read at the same time every day, weekends included.
Days 13-14: graph and write up.
Temperature and humidity belong on a line graph; daily rainfall on a bar chart. Our guides to choosing the right graph for your data and reading trends in a line graph cover both. Pick one pattern, such as humidity rising on rainy days, and say what your instruments could not measure. For an exhibition, our guide to making a research poster shows how to lay it out. Set up on open ground or a fenced terrace with an adult, never near a roof edge.
Not sure where to begin? Fermi's AI tutor can work out what you already know about heat and evaporation and build a plan for the session, so you sit down to a clear next step.