

On this page
How do you identify an increase or decrease on a line graph?
A line graph displays continuous change by plotting paired coordinates across two axes, placing the independent variable on the horizontal axis and the measured variable on the vertical axis. Reading from left to right, an upward slanting line marks an increase (Δy > 0), while a downward slanting line marks a decrease (Δy < 0).
Psychologists Jeff Zacks and Barbara Tversky (1999) demonstrated that connecting data points with lines primes people to perceive continuous trends and slopes rather than separate categories. In educational research, Frances R. Curcio (1987) tested 389 fourth- and seventh-grade students and identified three levels of graph comprehension: "reading the data" (extracting specific values directly stated), "reading between the data" (comparing values and identifying relationships or trends), and "reading beyond the data" (extrapolating and predicting unstated trends). As outlined in NCERT Class 8 Mathematics, reading a line graph requires moving beyond isolated points to track changes across intervals. For discrete categories rather than continuous trends, see our guide on differences between bar graphs and histograms.
How do you spot the steepest rise on a graph?
Spotting which segment rises fastest is a standard question in science and maths exams. The most common mistake is picking the highest point. In the *American Journal of Physics*, Lillian C. McDermott, Mark L. Rosenquist, and Emily H. van Zee (1987) documented a persistent "slope/height confusion": students evaluate rate of change by vertical height rather than steepness.
Steepness is determined by the slope (gradient), which measures the rate of change:
Rate of change = Slope = Δy / Δx = (y₂ − y₁) / (x₂ − x₁)
A steep segment means a large change occurred over a brief interval, whereas a gentle slope indicates gradual change. If horizontal intervals between markers are unequal, visual angles can deceive you. Always divide the vertical rise by the horizontal run: the segment with the greatest positive quotient is the steepest rise.
What does a flat line really mean?
A horizontal segment has a slope of zero because the vertical change is zero (Δy = 0) while the horizontal value advances (Δx > 0). The measured quantity remains constant.
However, students frequently assume a flat line means all activity or motion has stopped. As McDermott et al. (1987) and Gaea Leinhardt, Orit Zaslavsky, and Mary Kay Stein (1990) pointed out, the meaning of a flat line depends entirely on the vertical axis. Under the NCERT Class 9 Science Motion curriculum:
On a distance-time graph, a flat line means distance is constant, indicating the object is stationary (velocity is zero).
On a velocity-time graph, a flat line means velocity is constant, indicating the object is moving forward steadily with zero acceleration.
On a heating curve, a flat line marks a phase change where heat breaks bonds without changing temperature, as seen in latent heat plateaus on the heating curve of ice.
A step-by-step worked example: calculating slope and rate of change
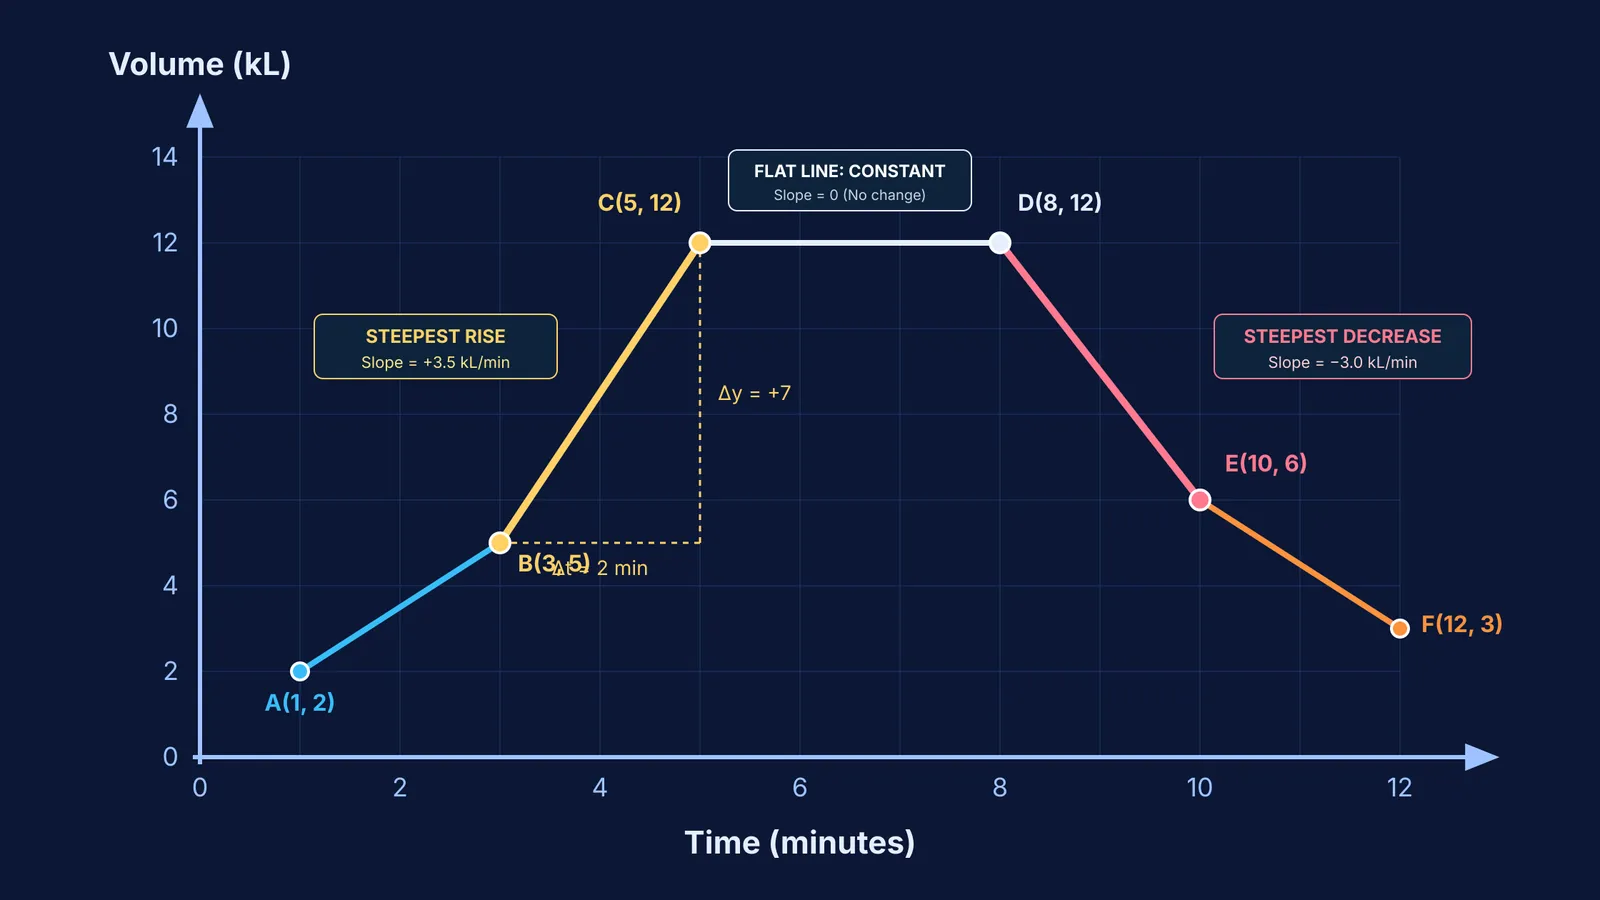
Consider a line graph tracking water volume over 12 minutes through six recorded points: A(1, 2), B(3, 5), C(5, 12), D(8, 12), E(10, 6), and F(12, 3). Evaluating each interval:
Interval 1 (t = 1 to 3 min): Volume rises from 2 to 5 kL. Δy = +3, Δt = 2 min. Slope = +3 / 2 = +1.5 kL/min.
Interval 2 (t = 3 to 5 min): Volume rises from 5 to 12 kL. Δy = +7, Δt = 2 min. Slope = +7 / 2 = +3.5 kL/min. This is the steepest rise on the graph.
Interval 3 (t = 5 to 8 min): Volume holds at 12 kL. Δy = 0, Δt = 3 min. Slope = 0 / 3 = 0 kL/min. A constant volume plateau.
Interval 4 (t = 8 to 10 min): Volume falls from 12 to 6 kL. Δy = −6, Δt = 2 min. Slope = −6 / 2 = −3.0 kL/min. The steepest decrease.
Interval 5 (t = 10 to 12 min): Volume falls from 6 to 3 kL. Δy = −3, Δt = 2 min. Slope = −3 / 2 = −1.5 kL/min.
When you need to practice multi-step kinematics or calculus questions without getting stuck on wrong-method mistakes, the Fermi Problem Library provides worked problems with a step-by-step solver that explains the reasoning rather than printing an answer.
Three common graphing traps and how to avoid them
Watch for three frequent traps when analysing line graphs:
The graph-as-picture error: Leinhardt et al. (1990) showed students often treat a line graph as a literal drawing of a hill or road. An upward slant is not a physical slope; it represents an increasing numerical value.
Unequal interval illusions: A segment can appear steep simply because horizontal markers are spaced closely. Always calculate Δy / Δx directly.
Truncated vertical axes: When the vertical axis omits zero, tiny changes look enormous. Learn more in our guide to spotting misleading graphs.
To connect graph interpretation to underlying mathematical definitions, the Fermi Concept Library covers every concept in physics, chemistry, biology, mathematics and computing, each with its own lesson and its place in the map. Check your axes, calculate Δy and Δx directly, and let the numbers guide your conclusions.


