

On this page
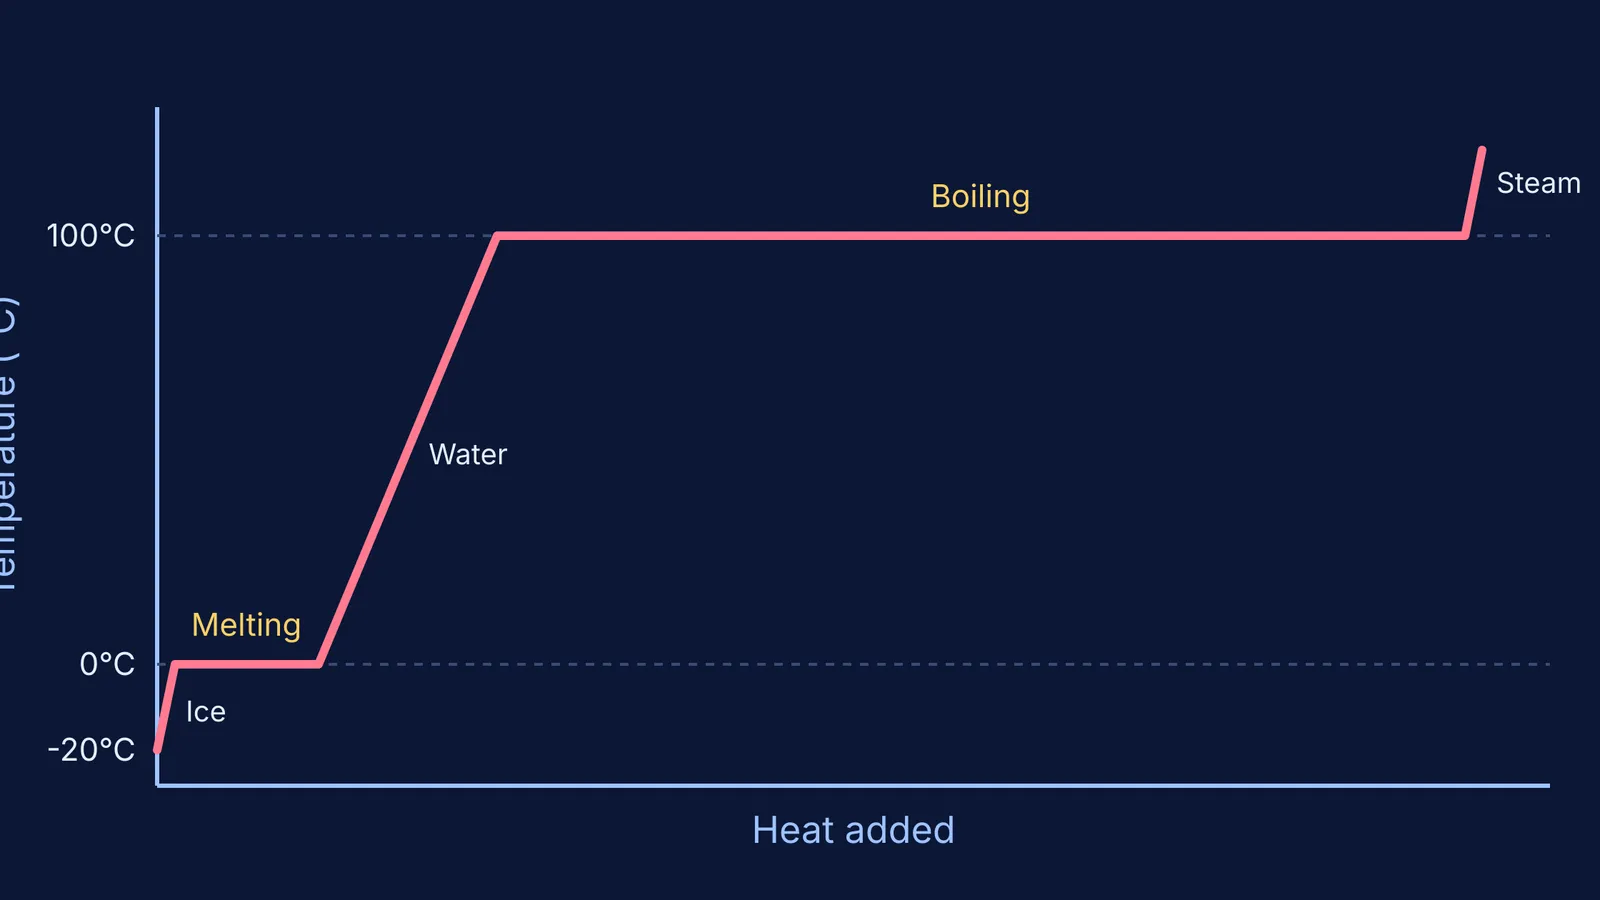
When you heat ice, its temperature does not rise smoothly from start to finish. Instead, the graph of temperature against time has two completely flat regions where the temperature stops rising, even though you are still adding heat.
These flat sections represent phase changes: melting and boiling. To understand why the temperature stalls, you need to look at what the heat energy is doing at the molecular level.
What does the heating curve of ice look like?
If you take a block of ice at −20 °C and apply steady heat until it becomes steam, a temperature-time graph of the process has five distinct parts:
Warming the ice: The temperature rises steadily from −20 °C to 0 °C.
Melting (flat part): The temperature stays exactly at 0 °C until all the ice has turned into liquid water.
Warming the water: The temperature rises from 0 °C to 100 °C.
Boiling (long flat part): The temperature stops rising again and stays at 100 °C while the water turns into steam.
Warming the steam: Once all the liquid is gone, the steam's temperature begins to rise above 100 °C.
This curve is a classic example of reading physics graphs: the sloped regions show temperature changes, and the flat regions show phase changes.
Why does the heating curve of ice go flat at 0 °C?
At 0 °C, the ice reaches its melting point. Even though the heater is still supplying energy, the thermometer stops rising.
The heat added during this flat region is called latent heat (from the Latin for "hidden"), because it does not show up as a temperature change. Specifically, this is the latent heat of fusion. According to the Wikipedia compilation of thermodynamic properties, the latent heat of fusion for water is 333.55 kJ/kg at 0 °C (Wikipedia).
Instead of making the water molecules vibrate faster (which would raise the temperature), the added energy goes into breaking the hydrogen bonds that hold the molecules in a rigid crystal lattice. The temperature will only start rising again once the last piece of ice has melted.
What happens at the 100 °C flat part?
Once the ice has fully melted, the liquid water heats up until it reaches 100 °C. Here, the curve goes flat for a second time, and it stays flat for much longer than it did during melting.
This is the boiling phase, governed by the latent heat of vaporization. The latent heat of vaporization for water is 2257 kJ/kg at its normal boiling point (Wikipedia). This is nearly seven times the energy required to melt the same amount of ice.
Why does boiling take so much more energy? When ice melts, the molecules break out of their rigid structure but still stay close together as a liquid. When water boils, the molecules must be completely torn apart from each other and pushed out into the air as a gas. You can use the Fermi Simulation Lab to model these energy transfers visually and track how much heat goes into bond-breaking versus temperature changes.
How to calculate latent heat in exam problems?
In physics and chemistry exams, heating curve questions often ask you to calculate the total heat required for a multi-step process using standard thermodynamic values (Wikipedia).
For the sloped parts of the graph, use the specific heat capacity formula: Q = mcΔT
For the flat parts of the graph, use the latent heat formula: Q = mL (where L is either the latent heat of fusion or vaporization).
Worked Example: How much heat is needed to turn 10 g (0.01 kg) of ice at 0 °C into water at 20 °C?
Melt the ice (flat part): Q = mL = 0.01 kg × 333,550 J/kg = 3,335.5 J
Heat the water (sloped part): Q = mcΔT = 0.01 kg × 4,180 J/(kg·°C) × 20 °C = 836 J
Total Heat: 3,335.5 J + 836 J = 4,171.5 J
When solving calorimetry problems, drawing a quick sketch of the heating curve helps you remember which formulas to use. You can also use the Fermi Problem Library to check your step-by-step working and ensure you have not missed any phase changes.


