On this page
Most misleading graphs don't contain a single false number. The trick is in how the numbers are drawn: where the axis starts, how the steps are spaced, which months get shown. Once you know the seven usual tricks, you can check a chart in a newspaper, an ad or a school project quickly, and fix your own.
Why do misleading graphs fool smart readers?
Your eyes judge some things much better than others. In a classic 1984 study, William Cleveland and Robert McGill found that people read position along a common scale most accurately, with angle and area judged less well (Cleveland and McGill, Journal of the American Statistical Association; summary in Cornell's course notes). Average errors for angles were considerably larger than for positions, which is why a bar chart is easier to read than a pie.
Distortions exploit those habits. A 2015 New York University study found that truncated axes, area used as quantity, stretched aspect ratios and inverted axes all led readers to misread a chart's message (Pandey and colleagues, CHI 2015; summary). A 2020 study found the exaggeration from a truncated y-axis persists even when the chart carries explicit visual cues that the axis was cut (Correll, Bertini and Franconeri, CHI 2020). So don't rely on a warning mark to undo the effect: read the axis numbers yourself.
What should you check on every graph?
Does the bar chart start at zero? A bar's length stands for its value, so cutting the bottom off makes small gaps look huge. Bergstrom and West call this the principle of proportional ink: a shaded area should be directly proportional to the value it shows. Fix: start bars at zero. Line charts are different, since they use position rather than shaded area, so a tighter axis is fine there.
Are the axis steps even? Look at the tick labels, not the gridlines. If 10, 20, 50, 100 sit at equal spacing, the scale is uneven. Fix: use equal steps, or if a logarithmic scale is genuinely needed, label it clearly and say so in the caption.
Is the time window fair? A short rise can sit inside a long fall. Fix: show the longest sensible range.
Is it a 3D chart or a pie? Perspective hides the true lengths and sizes, and Bergstrom and West note that 3D effects add ink that carries no information about the data. Fix: a flat bar chart, sorted largest to smallest.
Are there two y-axes? Lisa Charlotte Muth of Datawrapper points out that the scales of dual-axis charts are arbitrary, so the designer can make two lines cross or move together at will (Datawrapper). Fix: two charts side by side, or one chart showing percentage change from a common starting point.
Does the size of an icon match the value? Doubling a coin's width quadruples its area. Fix: bars, or icons repeated rather than enlarged.
Is an axis flipped or stretched? An upside-down y-axis can reverse the message, and squashing or stretching a line chart changes how steep a trend feels (summary of Pandey and colleagues). Fix: zero at the bottom, bigger values higher, and a plot shape that neither flattens nor exaggerates the trend.
How do you measure how much a graph exaggerates?
Edward Tufte's lie factor is the size of the effect shown in the graphic divided by the size of the effect in the data, so a value of 1 means the drawing matches the data (edwardtufte.com).
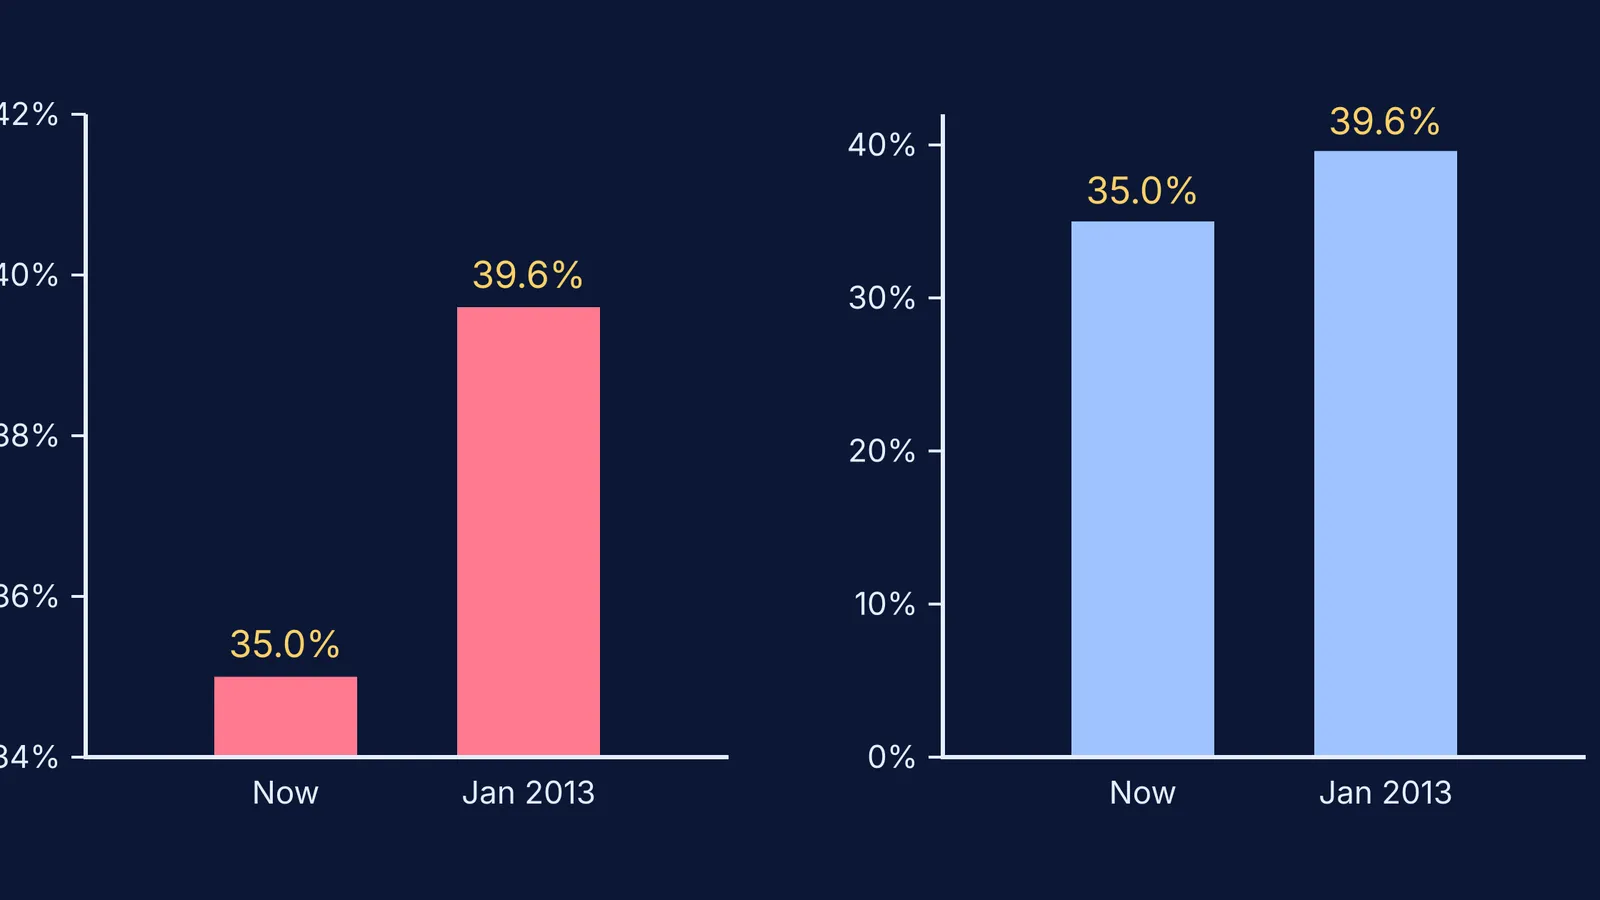
Here is a real case, reproduced in the 2020 CHI paper: a Fox News bar chart compared a top tax rate of 35.0% now with 39.6% if tax cuts expired, on an axis starting at 34%.
Effect in the data: 39.6 ÷ 35.0 = 1.13, about a 13% rise.
Effect in the drawing: the bars rise 1.0 and 5.6 units above 34, so the second bar is 5.6 times taller (the paper rounds this to 6), a 460% rise.
Lie factor: 460 ÷ 13 = about 35.
The corrected chart starts at zero, and the second bar is only 13% taller. The hero image above shows both versions.
How can you practise spotting misleading graphs?
Once a week, pick one chart from a newspaper or social media, run the checklist, and redraw it honestly on graph paper. With a parent, try a debate: one person defends the chart, the other attacks it.
For background, read about William Playfair and the bar chart, John Tukey and the box plot, and the Keeling carbon dioxide curve with real data.
If the idea under a graph is shaky, such as what a slope means, look it up in the Fermi Concept Library, which covers every concept in physics, chemistry, biology, mathematics and computing. And for ideas that are easier to see than to read, the Fermi Simulation Lab has interactive simulations to explore.