
On this page
Your child reads the motion chapter twice and still mixes up distance and displacement, or looks at a graph and sees nothing. That is common, and you can help without being a physics teacher. The NCERT Class 9 textbook *Exploration* opens its chapter Describing Motion Around Us with a girl in a car behind a truck and asks how much distance to keep from the truck ahead. Everyday travel is the starting point, so your walks and drives make a good lab.
Why does my Class 9 child find the motion chapter hard?
Several new ideas arrive together: displacement, average velocity, average acceleration and motion graphs. In the NCERT chapter, displacement is defined as the net change in the position of an object between two instants of time. Its example: an athlete who runs out and partly back has covered a total distance of 160 m, but her displacement is only 40 m.
Graphs are often the hardest part. Lillian McDermott, Mark Rosenquist and Emily van Zee studied several hundred university students in a preparatory physics course and found they struggled to connect graphs to physical concepts and to the real world (American Journal of Physics, 1987).
Robert Beichner summed up the known difficulties, including reading graphs as pictures and confusing slope with height, and built a graph test that he gave to 895 high-school and college students (American Journal of Physics, 1994). If older students trip over this, your child is not "bad at science".
How can I explain distance, speed and graphs on a walk?
The chapter's tools are simple: average speed is the total distance travelled divided by the time interval, and the slope of a position-time graph gives the velocity (NCERT, Chapter 4).
Start from a fixed point, such as your gate. Your child runs the phone stopwatch.
Note the time and distance at a few landmarks; a map app shows distances.
Include one stop and one fast stretch.
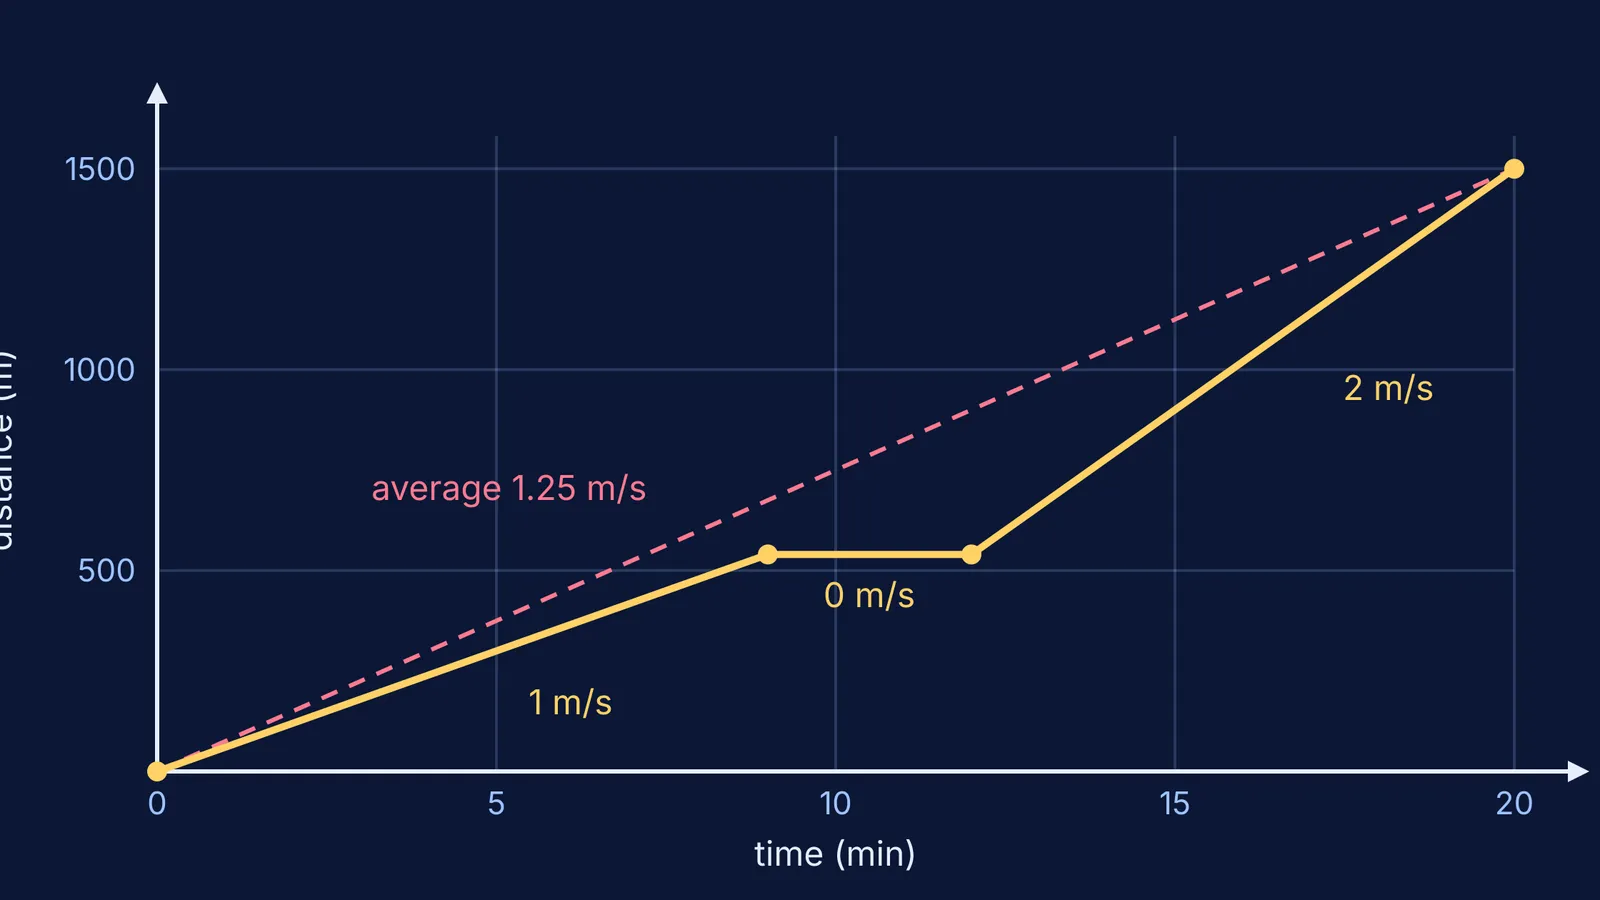
At home, plot time on the x-axis and distance on the y-axis.
A worked example:
First 9 minutes: 540 m at a steady pace. Speed = 540 m ÷ 540 s = 1 m/s.
Next 3 minutes: waiting at a crossing. Distance does not change, so speed = 0 and the graph is flat.
Last 8 minutes: you jog 960 m. Speed = 960 m ÷ 480 s = 2 m/s, the steepest part of the graph.
Whole trip: 1500 m in 20 minutes (1200 s). Average speed = 1500 ÷ 1200 = 1.25 m/s, or 4.5 km/h after multiplying by 3.6.
Then ask: "Where were we fastest? Where did we stop?" Note that 1.25 m/s is not the average of 1, 0 and 2; see why average speed for a round trip is not the simple average.
For displacement, walk back home: distance covered, displacement zero. NCERT's version is a swimmer, Sarang, who does a length and back of a 25 m pool in 50 s: average speed 1 m/s, average velocity 0 m/s.
What can a car ride teach about speed and velocity?
The speedometer shows speed in km/h, while the textbook works in m/s; NCERT's own example converts 72 km/h to 20 m/s (NCERT, Chapter 4). Divide by 3.6 to go from km/h to m/s.
As a passenger, your child notes the speedometer reading every five seconds as the car pulls away from a signal. At home, plot speed against time. A rising straight line means constant acceleration; a flat line means constant speed and zero acceleration, as the chapter's velocity-time graphs show.
Try the textbook's own road-trip question together: 200 km north in three hours, then 200 km south in two hours. Average speed is 400 km ÷ 5 h = 80 km/h, but average velocity is zero because you ended where you started.
How do we practise numericals together without a fight?
Keep it short: two or three questions from the NCERT exercises, and the same four lines every time.
What is given? Write each value with its unit.
What is asked?
Which formula links them?
Substitute with units, then ask: does the answer make sense?
What to say when they freeze:
"Don't tell me the answer yet. What moved, from where, and for how long?"
"Is this asking for distance or displacement? How do you know?"
"On our walk graph, what did the steep part mean?"
If the mistake is in the method rather than the arithmetic, the Fermi Problem Library has worked problems with a step-by-step solver that explains the reasoning rather than printing an answer. If graphs still feel abstract, the Fermi Simulation Lab has interactive simulations for ideas that are easier to see than read.
For more ideas, read how to teach speed, distance and time with a bicycle and how to check AI answers to Class 9 equations of motion numericals.
Take one walk this week, collect four readings and plot them together.