On this page
Bhuvan, the "Indian Geo Platform of ISRO", is an online map of India hosted by the National Remote Sensing Centre (NRSC) in Hyderabad. For a school geography or science project, it gives you satellite images of your own town, ready-made land use layers and tools to measure the ground yourself.
What is Bhuvan and what can you see on it?
The Bhuvan 2D viewer lists satellite imagery by resolution, from "HR data (25 cm)" down to "24m Data - LISS - III" and "56m Data - AWiFS". Resolution is the size of one pixel on the ground: on a 24 m layer, a pond 50 m across is only about two pixels wide, so pick the layer that matches the size of what you are studying. The viewer also has thematic layers such as waterbodies, crops and settlements.
For land use, NRSC's land use and land cover page describes three map series hosted on Bhuvan:
1:250,000: yearly from AWiFS images since the 2004-05 crop year.
1:50,000: from LISS-III images for 2005-06, 2011-12 and 2015-16, using 54 classes.
1:10,000: village-level maps on the Bhuvan Panchayat portal.
The 1:50,000 series suits most projects: detailed enough for a town, and repeated across years.
How to use ISRO Bhuvan to measure an area?
The 2D viewer's tools include "Measure Area", "Measure Length" and a "Draw Tool" for your own shapes. Menus can change between versions, so keep the Bhuvan User Handbook, linked from the Bhuvan home page, open beside you.
Open the 2D viewer and zoom to your lake, forest patch or town edge.
Turn on one imagery layer and write down its name and resolution.
Choose Measure Area, click around the edge of the feature, then close the shape.
Write down the area. Trace it twice more and average the three.
Repeat on an image from another year, at the same resolution if you can.
Imagery layers have a swipe control to slide one image over another and spot change.
How do you show land use change between two years?
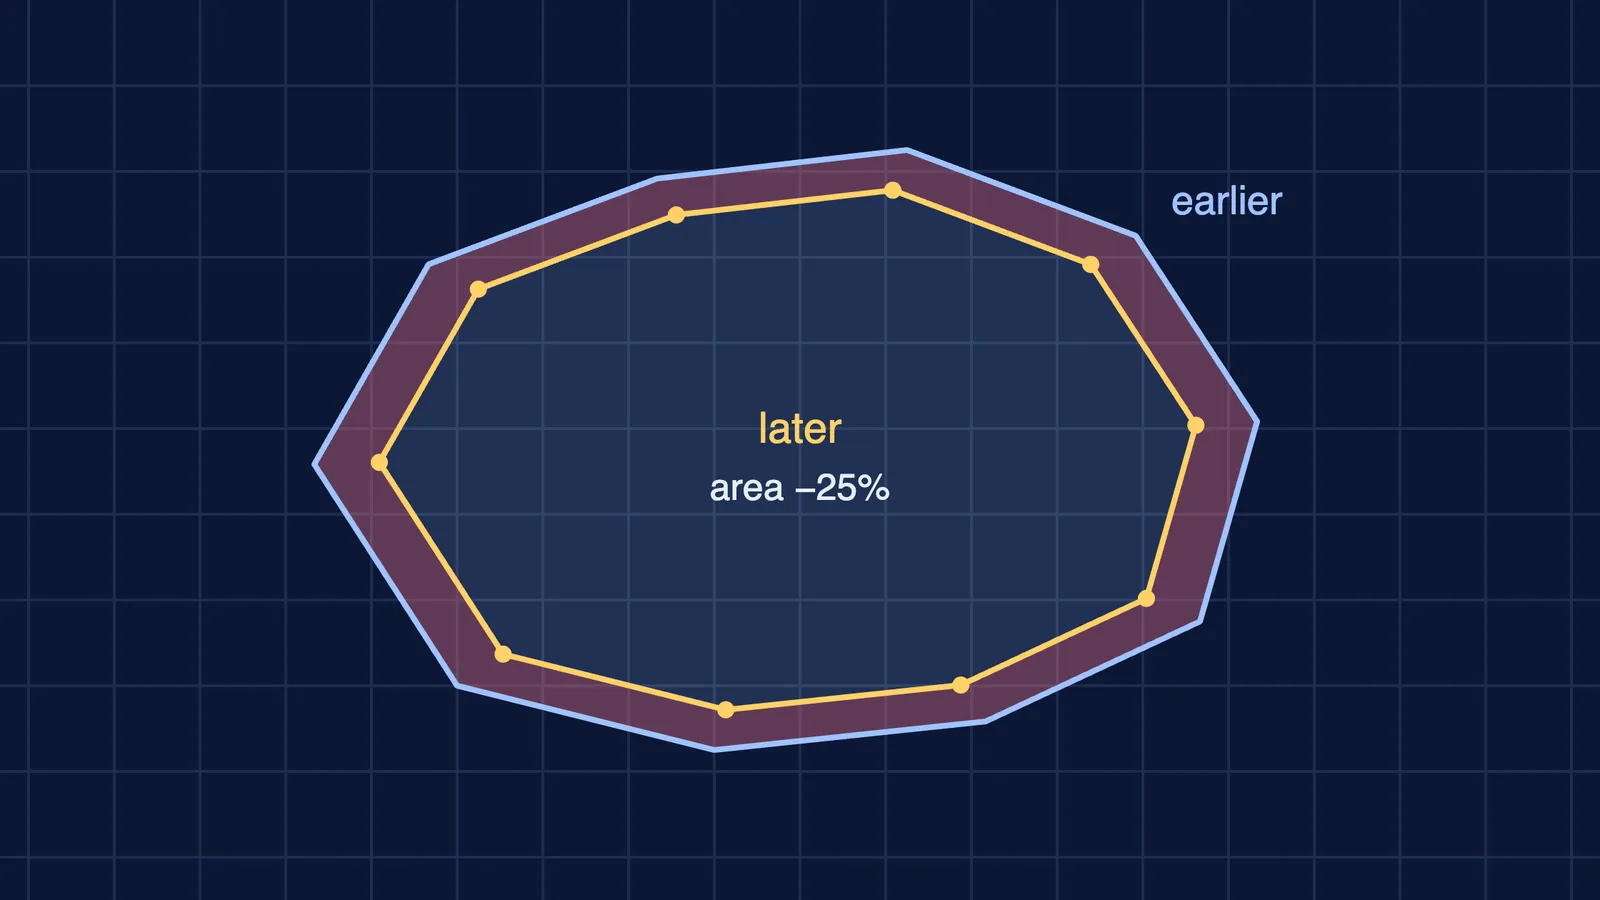
Here is a worked example with made-up numbers, traced on the 24 m LISS-III layer in the Bhuvan 2D viewer. Say your three traces of a lake average 2.4 km² on the older image and 1.8 km² on the newer one.
Change: 1.8 − 2.4 = −0.6 km².
Percentage change: −0.6 ÷ 2.4 × 100 = −25%.
Now the part most projects skip: how sure are you? A common rule of thumb is that your trace can be off by about half a pixel all along the edge, so a rough error is the perimeter times half the pixel size. If the lake's edge is about 6 km long on a 24 m layer, that is 6,000 m × 12 m = 72,000 m², or about 0.07 km²: 3% of the older area and 4% of the newer one. The change carries both errors, so add them: −0.6 ± 0.14 km², or −25% give or take 6 percentage points: clearly more than your tracing error. On the 56 m layer each outline's error is about 0.17 km², so the change is −0.6 ± 0.34 km²: still a drop, but a weaker conclusion.
Lakes also rise and fall with the seasons, so compare images from the same season; the viewer labels some LISS-III layers by season, such as 2014 (Rabi).
If percentages or the error sum are where you get stuck, the Fermi Problem Library has worked problems with a step-by-step solver that explains the reasoning rather than printing an answer.
What project questions work well with Bhuvan?
Good questions are about one place, two dates and one thing you can measure:
Has a lake or tank in your city shrunk, and by how much?
How much farmland on the edge of your town has turned into built-up land?
Has the forest cover near a hill town changed between two map years?
Write it up as question, data (layer, date, resolution), method, result with error, and limits. Our guide to how science fair projects are judged shows where each part earns marks. If your area is large, it helps to know why flat maps stretch some areas; for a hilly site, reading contour lines explains how land is used.
Can you use Bhuvan images in a school project?
Bhuvan's terms of service say image and map data are "provided for viewing purposes only", and that without prior written authorisation from DOS/ISRO/NRSC you must not copy, make derivative works of, redistribute or publish the content. So:
Ask your teacher whether screenshots are acceptable, and credit each one: "Source: Bhuvan, ISRO/NRSC", plus layer and year.
Before posting online or entering a public competition, ask the Bhuvan team for permission via the home page contact address.
You can always report your measurements with your own sketch map.
For data files, use the Open Data Archive linked from the home page; the terms rule out mass downloads.
Pick one place near you this week, measure it on two dates and write down the error.