On this page
Before you read on, try a prediction. A reaction loses reactant at a fixed speed, say 0.02 mol L⁻¹ every minute, whatever the concentration. Sketch [A] against time. Then sketch a reaction whose speed is proportional to how much reactant is left. Which one hits zero, and which one keeps getting slower?
If you drew a straight line for the first and a sagging curve for the second, you have already done most of the work. This post checks those sketches against the textbook equations, puts numbers on them, and shows the half-life pattern that tells the two apart.
What does a zero-order concentration-time graph look like?
In NCERT's Class 12 Chemistry chapter on chemical kinetics, a zero-order reaction is one where the rate is independent of the concentration of reactants. Integrating rate = k gives the integrated rate equation [R] = −kt + [R]0. That is the equation of a straight line: plot [R] against t and you get a slope of −k and an intercept of [R]0.
The same chapter gives real examples. The decomposition of gaseous ammonia on a hot platinum surface at high pressure is zero order, because the metal surface is saturated with gas molecules and adding more ammonia cannot speed it up. The thermal decomposition of HI on a gold surface is another.
Two things follow from the straight line. The reactant runs out completely at t = [R]0/k. And the graph has no curve to it: while the reaction stays zero order, it is just as fast at the end as at the start.
How is the first-order graph different?
For a first-order reaction, the rate is proportional to [R], and NCERT integrates this to ln[R] = −kt + ln[R]0 (NCERT, Chemical Kinetics). Undo the logarithm and [R] = [R]0 e^(−kt): an exponential decay. The [R] against t graph is a curve that starts steep, flattens out, and approaches zero without ever touching it.
The straight line hides in the log plot instead. LibreTexts' page on first-order reactions/Kinetics/02%3A_Reaction_Rates/2.03%3A_First-Order_Reactions) puts it this way: a plot of ln[A] against time is a straight line with slope −k.
We go through all three straight-line tests (zero, first and second order) in our guide to reading integrated rate law graphs.
What is the half-life of a zero-order vs a first-order reaction?
LibreTexts' half-lives page/Kinetics/02%3A_Reaction_Rates/2.04%3A_Half-lives) gives both formulas.
Zero order: t½ = [A]0/2k. The half-life is proportional to the starting concentration, so it gets shorter as the reactant is used up.
First order: t½ = ln 2/k ≈ 0.693/k. The half-life depends only on k, so it stays the same however much reactant is left.
Worked example: same start, same first half-life
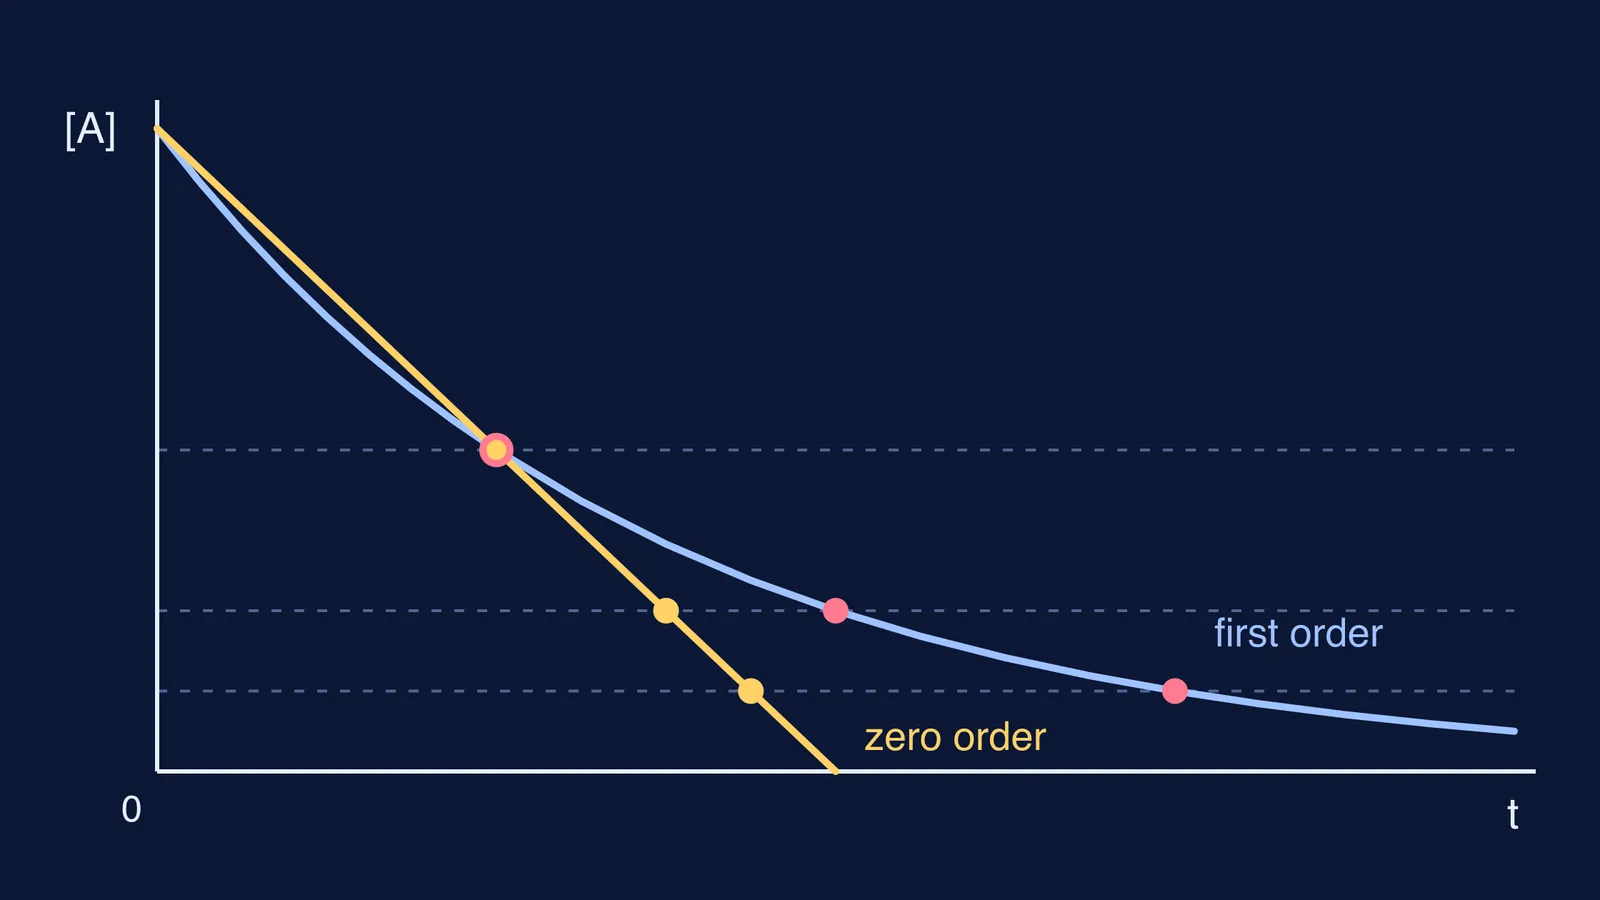
Take two reactions that both start at [A]0 = 0.80 mol L⁻¹ and both take 20 minutes to reach 0.40 mol L⁻¹.
Zero order: 20 = 0.80/2k, so k = 0.020 mol L⁻¹ min⁻¹. First order: k = 0.693/20 ≈ 0.0347 min⁻¹. Now follow each one, using the half-life formulas from LibreTexts/Kinetics/02%3A_Reaction_Rates/2.04%3A_Half-lives).
0.80 to 0.40: zero order takes 20 min, first order takes 20 min.
0.40 to 0.20: zero order takes 0.40/(2 × 0.020) = 10 min, first order takes 20 min.
0.20 to 0.10: zero order takes 5 min, first order takes 20 min.
0.10 to 0: zero order takes the last 5 min and is empty at 40 min. First order only reaches 0.10 at 60 min and keeps halving every 20 min.
The hero graph at the top of this post plots exactly these numbers. Both start at the same point and cross at the first half-life. After that the straight line drops to zero while the curve keeps flattening out.
To watch a constant half-life build up from random events, try our dice model of a first-order reaction. For orders beyond 0 and 1, see how half-life depends on initial concentration for any order.
How do you tell the order from a graph in the exam?
Use this checklist on any concentration-time data:
Is [A] against t a straight line that reaches the time axis? Zero order; k = −slope.
Is [A] against t curved, but ln[A] against t straight? First order; k = −slope of the log plot.
Read off two successive half-lives. If each one is half the last, zero order. If they are equal, first order.
Check the units of k: mol L⁻¹ s⁻¹ for zero order, s⁻¹ for first order, per the units table in NCERT's chapter.
The shape of a curve is easier to see than to read about. The Fermi Simulation Lab has interactive simulations for ideas like this. Make your prediction first, then check it against the simulation. If you get stuck on a numerical, the Fermi Problem Library has a step-by-step solver that explains the reasoning, so you can see where your setup went wrong.