On this page
You photograph a velocity-time graph, type "what is the displacement?", and an AI answers in seconds. That is multimodal AI. It is useful, and it can make a mistake a text-only chatbot cannot: misread the picture, then reason perfectly from the wrong numbers. Here is how it works and how to catch that.
What is multimodal AI, in simple words?
A modality is a type of input: text, images, audio or video. A multimodal AI model accepts more than one of these and works on them together, instead of handling typed text alone.
The GPT-4o System Card describes a model that "accepts as input any combination of text, audio, image, and video", with all inputs and outputs "processed by the same neural network". It reports that the model can answer spoken input in as little as 232 milliseconds, averaging 320 milliseconds, close to the pace of human conversation.
It is like studying a textbook page: you read the paragraph, look at the figure and hear your teacher, all at once. For how these models are built in the first place, see AI vs machine learning vs deep learning, with one example each.
What does it add when you study diagrams and graphs?
You can show the problem instead of retyping it: a circuit, a titration curve, your handwritten working.
You can ask about one part of a figure: "why does the graph flatten after 4 s?"
You can talk a doubt through aloud while revising, then ask for the steps in writing.
This is where a tutor that teaches with pictures helps. Fermi's AI tutor can take a scanned assignment, work out what you already know, and teach through it by writing on a board and drawing the figure, so the picture becomes part of the explanation.
Where does AI vision still fail?
Researchers have measured the gaps directly.
Simple geometry. In the 2024 BlindTest study, four leading vision-language models averaged 58.07% accuracy on tasks people find easy, such as whether two circles overlap or where lines cross.
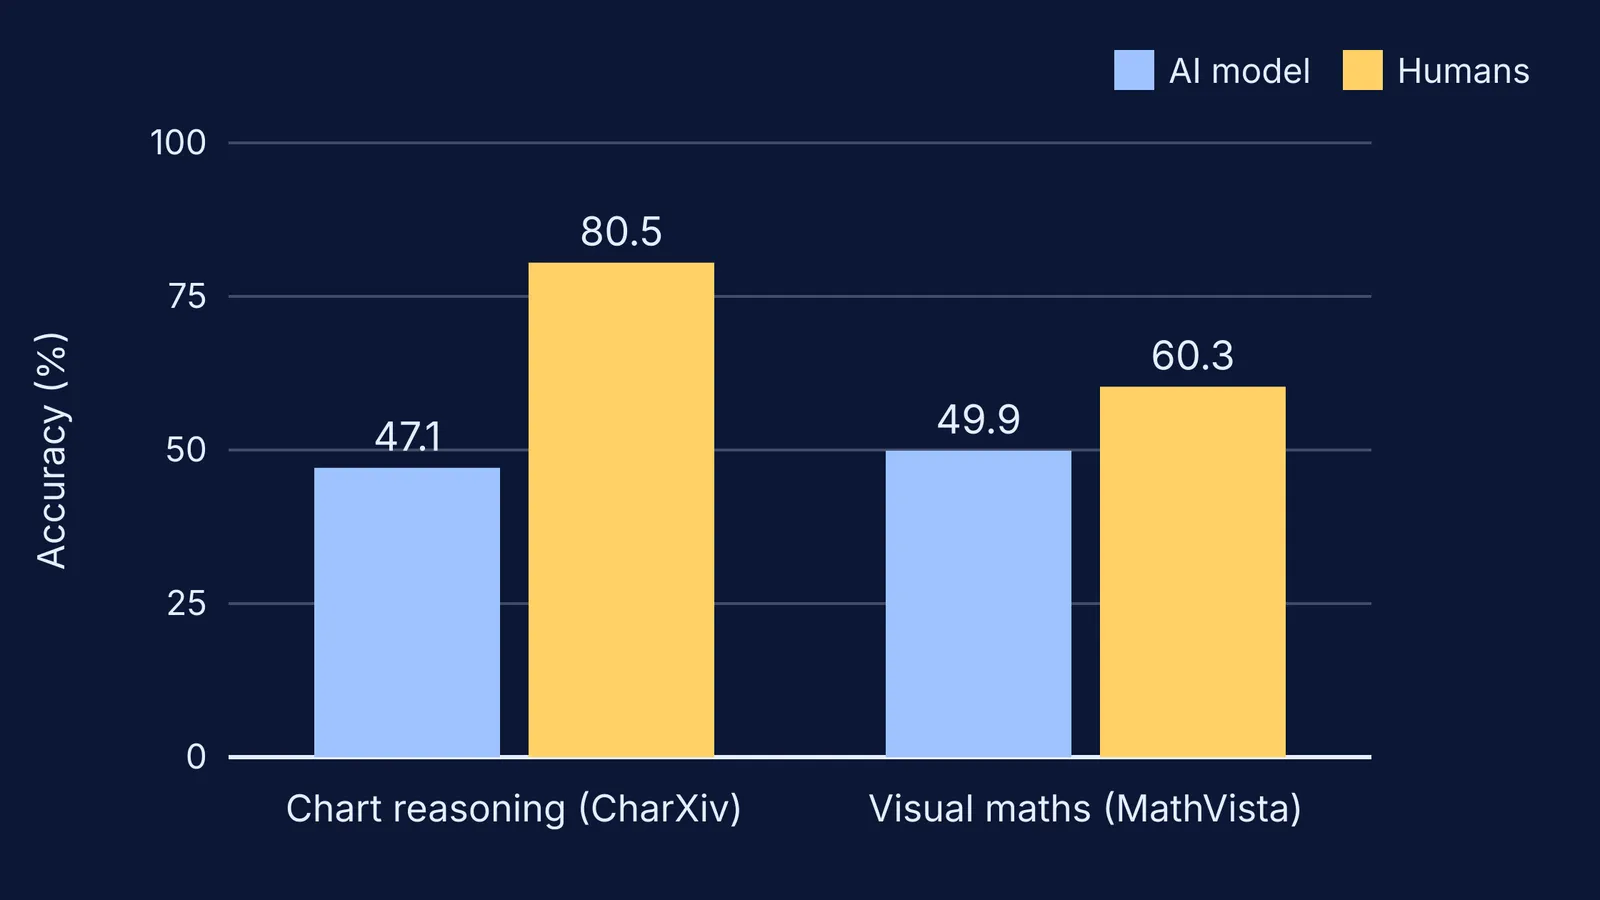
Real charts. On CharXiv, built from 2,323 charts in research papers, GPT-4o scored 47.1% on chart reasoning, against 80.5% for humans.
Maths with figures. On MathVista, GPT-4V scored 49.9% against 60.3% for humans; the authors note it "often struggles to understand complex figures".
Leaning on the words. The MathVerse team found that many visual maths benchmarks put the diagram's content into the question text, which may help a model answer "without truly interpreting the input diagrams".
Seeing what it expects. In Vision Language Models are Biased, models averaged 17.05% accuracy when counting in subtly altered images of familiar things, such as a logo with an extra stripe.
Newer models have appeared since these tests, so treat the numbers as a snapshot. The types of task are what to watch: exact positions, crossings, small labels, and anything familiar that has been changed.
How do you check what the AI actually saw?
Use a read-back-before-solve routine. Worked example: you upload a v-t graph and ask for the displacement in the first 6 s.
Ask it to describe, not solve. "List the axis labels, units and the coordinates of every corner point." Suppose it replies (0, 0), (4 s, 20 m/s), (6 s, 20 m/s).
Compare with the page. Your graph actually peaks at 10 m/s. Correct it: "The value at 4 s is 10 m/s."
Now ask for the method. Displacement is the area under the graph: a triangle of ½ × 4 × 10 = 20 m plus a rectangle of 2 × 10 = 20 m, so 40 m. With the misread value it would have said 80 m, in equally tidy steps.
Sanity-check the size. Never faster than 10 m/s for 6 s means at most 60 m, so 40 m is plausible and 80 m is not.
The same habit works for forces; see how to check an AI free-body diagram. For graphs in news and textbooks, keep this checklist for spotting a misleading graph handy.
If the trouble is picturing the idea itself rather than reading one figure, the Fermi Simulation Lab has interactive simulations for ideas that are easier to see than to read.
Next time you upload a graph, ask the AI to read it back to you first.