On this page
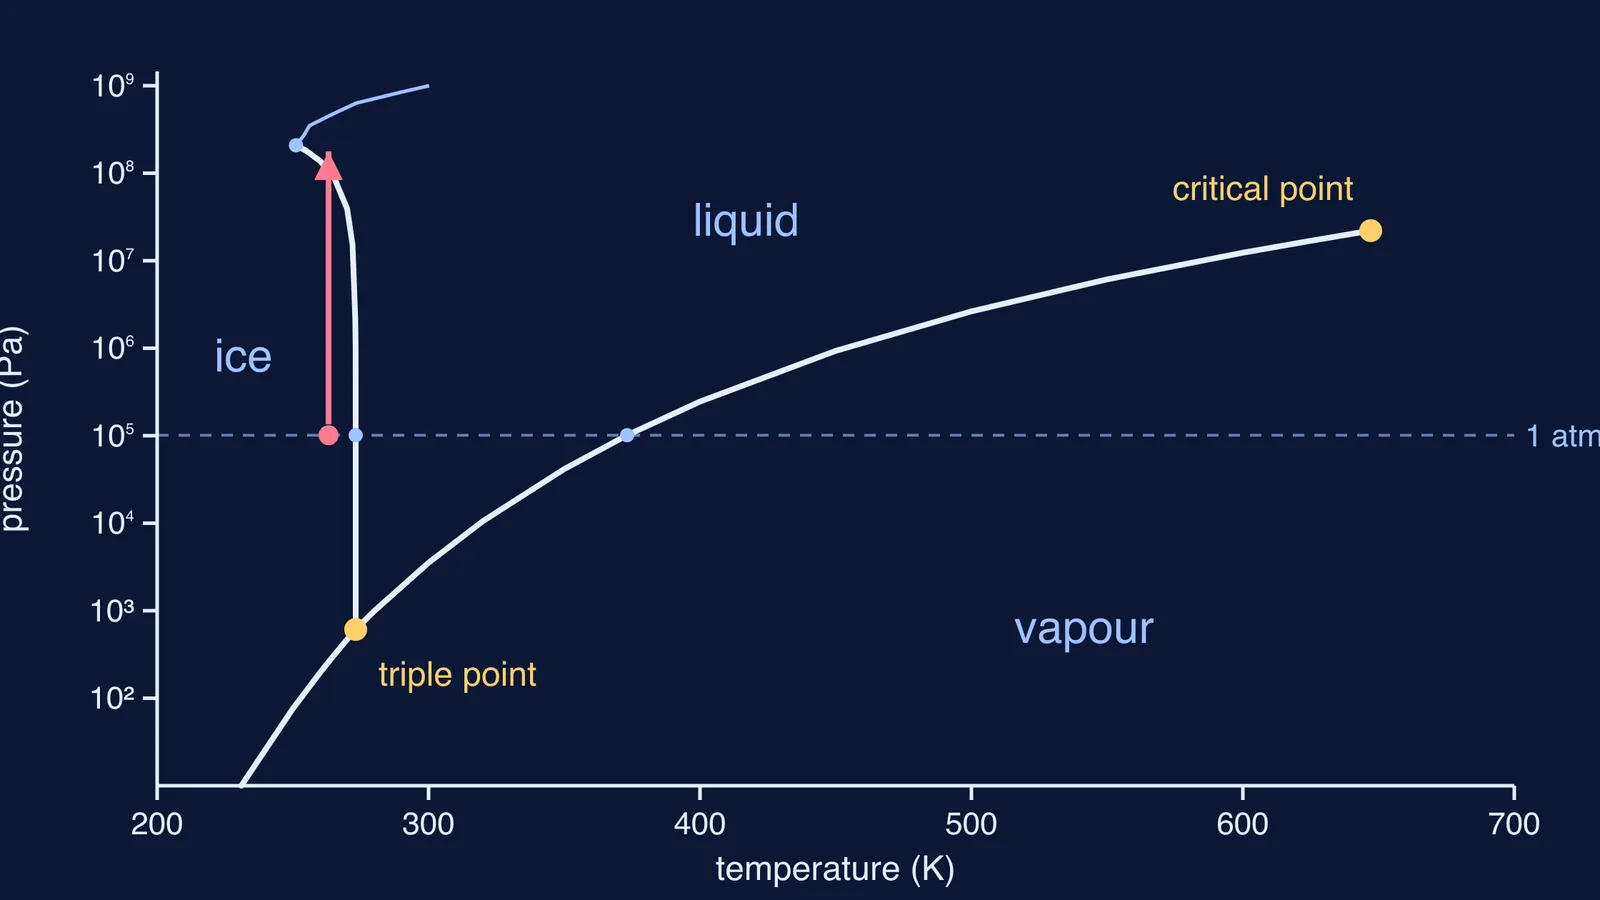
A phase diagram is a map. Temperature runs along the bottom, pressure runs up the side, and every point on the map tells you whether water is solid, liquid or gas there. Three lines divide the map, and the point where they meet is the triple point. Once you can move a point around this map in your head, pressure cookers, ice skates and freeze-drying become one picture.
What is the triple point of water?
The triple point of water is 273.16 K (0.01 °C) at 611.657 Pa. It is the only temperature and pressure where ice, liquid water and water vapour exist together in equilibrium. The paper behind the IAPWS melting and sublimation equations, by Wagner and colleagues (2011), uses these values. That pressure is about 0.6% of normal air pressure (101,325 Pa), which is why you never see it in a kitchen.
Below the triple-point pressure, liquid water is not stable. Warm ice there and it turns straight into vapour, which is sublimation. The same process causes freezer burn on food.
At the other end of the map, the boiling line stops at the critical point, 647.096 K and 22.064 MPa. Those values come from the IAPWS saturation equations published by Wagner and Pruss (1993). Beyond that point, liquid and vapour are no longer separate phases.
Why does ice melt under pressure?
For most substances, the solid–liquid line leans to the right: squeeze them and they need a higher temperature to melt. Water's line leans to the left. The reason is density. The USGS Water Science School says that on freezing, the density of ice decreases by about 9 percent. The molecules lock into an open, hydrogen-bonded lattice. You can build that lattice in our post on why ice floats. Pushing on ice favours the phase that takes up less room, and for water that phase is the liquid.
Per pascal, the effect is small. The melting-pressure data from Wagner and colleagues show ice melting at 273 K (−0.15 °C) under 2.15 MPa, at 272 K under 15.1 MPa and at 260 K under 138 MPa. The line ends at 251.165 K and 208.566 MPa. Beyond that point a denser form called ice III takes over. Near 0 °C, then, each extra 13 MPa or so (about 130 times normal air pressure) lowers the melting point by roughly one degree.
Move the point: four trips around the diagram
Start at 1 atm and −10 °C. You are in the ice region. Now move:
Straight up: more pressure, same temperature. Interpolating the IAPWS melting data, you cross the melting line at roughly 110 MPa and the ice turns to liquid. This is the pink arrow in the diagram.
Back to 1 atm, then right: heating at constant pressure. You cross the melting line at 0 °C and then the boiling line. The vapour-pressure equation from Wagner and Pruss puts that boiling point at 373.12 K, just under 100 °C.
Down below 611.657 Pa, then right. You never meet the liquid. Ice sublimes straight to vapour, and freeze-drying works in this region.
Along the boiling line, upwards. Higher pressure means a higher boiling point, which is how a pressure cooker works. The line ends at the critical point.
Can a skater's weight melt ice? A worked example
Take a 60 kg skater standing on one blade. Assume the blade touches the ice over a patch 3 mm wide and 10 cm long.
Force: 60 kg × 9.8 m/s² ≈ 590 N.
Area: 0.003 m × 0.10 m = 3 × 10⁻⁴ m².
Pressure: 590 N ÷ 3 × 10⁻⁴ m² ≈ 2 MPa.
The IAPWS melting data show that 2.15 MPa lowers the melting point only to −0.15 °C. On rink ice at −10 °C you would need about 110 MPa, more than 50 times what the blade supplies. On these numbers, pressure melting alone cannot explain why skates glide on cold ice. Our post on regelation and why skaters still glide covers what else is going on. These inputs are rough, but even a patch several times smaller would fall well short.
How do you read a phase diagram in an exam?
Use this checklist on any phase-diagram question:
Read the axes and units first. Textbook sketches are rarely to scale, and many use a log pressure axis, as our diagram does.
Mark the triple point and the critical point before anything else.
Place the starting state, then move it the way the question describes: heating moves right, compressing moves up.
Every line you cross is a phase change. Name it: melting, freezing, boiling, condensation, sublimation or deposition.
Before answering whether pressure raises or lowers a melting point, check which way the solid–liquid line leans.
It's easier to read the diagram once you have moved the point yourself. The Fermi Simulation Lab has interactive simulations for ideas that are easier to see than to read. If phase changes are a gap for you, the Fermi Concept Library gives each concept its own lesson and shows its place in the map.